
User manual
Information technology solutions that make it possible to implement a scalable, solid and reliable computing architecture in a hybrid cloud.
Presentation
This document has as objective to explain the uCloud portal usage, a Cloud Service Broker Platform that allows the administration of several cloud service providers, whether they are private or public cloud providers.
In this manual are presented all the concepts, screens, functionalities and the usage commands for this product.
Introduction
The business organizations incorporate the cloud as a solution to manage their environments when using a combination of private and public clouds, the current great challenge is the management of these hybrid multi-cloud environments.
To reach a unified vision, as well as obtaining a control of the financial costs in a centralized way, since each business organization has a necessity and faces different challenges.
The uCloud platform was developed for these scenarios, independently of how many providers (publics and/or privates) there are the user can interact with their platforms:
Infrastructure as a Service (IaaS);
Platform as a Service (PaaS).
As previously mentioned, the uCloud is positioned with a Cloud Service Broker (CSB) platform that allows to manage multiple cloud services providers - privates as well as public cloud providers.
A CSB platform such as the uCloud platform allows the organizations to act in five fundamentals points for the management of hybrid multi-cloud environments, they are:
Financial Governance
Besides the infrastructure control, the uCloud platform allows the user companies of this application to establish goals, financial as well as quantitative resources (quotas). This financial or infrastructure limits, can be applied in three levels:
For a general public provider (see the item Companies, in the Administration menu);
For a group of users (see the item Groups, in the Administration menu);
For a user/individual (see the item Users, in the Administration menu).
Therefore, the organization applies criteria of financial governance and expenses control, it also can follow the costs of its hybrid multi-cloud environment through a single interface.
The adoption of the financial limit (quotas) application and/or computing resources in which several levels reach the user level, as well as the expenses control is effective and allows to avoid that the organization’s budget exceeds the limit and it is surprised with situations in which the computing infrastructure cost is exorbitant or above the pre-established values.
Another aspect of the uCloud platform is the reduction of the certification cost and specialist training, in each one of the interfaces of each provider (public and/or private), seen as the application of a usage interface and single management is simple, it allows to extract more productivity from the cloud provider environment.
Even if the user does not have training or certification on the provider specific console (public and/or private), the uCloud platform makes it possible for the user to provision a computing resource on the desired environment in a simple and easy way.
Billing (Services Invoicing)
The uCloud platform provides the business organizations with the recurrent costs information, this consumption regards to the usage of the computing resources on the operation(s) in a hybrid multi-cloud environment. This is only one of the points that are part of the Cloud Financial Management (FinOps) practice.
It is important to highlight that, individually, the uCloud platform does not meet all the three pillars of the FinOps practice by default. The Ustore has other products that can be complementary and these products” set has the potential to act as an environment able to comprise and meet the FinOps practice.
The question supported by the uCloud is the Inform point, the other points of this better FinOps practice: the Optimization and Operation belong to the other products of the Ustore’s portfolio that complements the uCloud platform.
It must be clarified that the uCloud platform does not create nor generate computing resource values, these amounts are generated in the public cloud providers which the uCloud application extracts (by downloading) the billing file (invoicing) of these providers. Then, add this information in their internal database. So that, according to the contract’s commercial criteria can be applied and, later, these costs calculated and converted to the current currency in Brazil.
That way, the user stays informed of the costs evolution and can follow if these costs are found within the organization’s financial governance criteria.
Generally these costs are presented in non-structured text files (Comma-separated Values - CSV) generated in each period (average of 8 hours). The uCloud platform adds the information of this .CSV file for its internal database, with the objective to speed up and simplify the presentation of these values on the user screen.
Exclusively, the users with a specific profile can view costs and stay informed of the total consumption values of their computing resources in each cloud provider (public and/or private). This allows the user to follow the active computing resources of the accumulated costs in the cloud services providers.
Monitoring the Infrastructure
An important functionality of the uCloud platform is the recent implementation of the events management module (monitoring) that allows to collect occurrences and alarms that were generated on the cloud environments (public and/or private), activate notifications and create custom reports.
All this easiness reduces the costs for the organizations, once it eliminates the necessity of hiring providers monitoring services, since that service can represent high costs, which may impact negatively on the budget (exceed the limit) destined for the public cloud infrastructure.
This functionality allows integration to an environment of Service Desk management for IT Service Management control.
Inventory (Assessment)
The uCloud platform connects with the cloud providers through the registering of specific access credentials of each cloud service supplier (public and/or private). For this purpose the companies must provide credentials of “operative” mode.
This operative credential is provided by the cloud service administrator and they are authorizations generated on the providers” account that only have permission to interact with a cloud public provider console through an API, they are not regular licenses with default login and password. That way, the security and the information security regulamentation rules are previewed and met in its totality.
Once the operative credentials are configured on the uCloud platform, the first activity is to synchronize the configuration and the computing resources inventory existing in the provider (virtual machines - workloads). This list is extracted and added to the uCloud database, in a way that the presentation on the user screen is fast.
With this inventory available directly inside the uCloud platform, the user can operate each one of the virtual machines, independently of which cloud provider this resource is provisioning. In the sequence, it is possible to view the operations to be applied to the computing resources existing in the cloud providers (public and/or private).
It is important to mention that the uCloud does not have any computing resources, these resources are in the public cloud service provider’s clouds or in the virtualization environments (hypervisors) installed in its private Datacenter. Through the API Rest the uCloud platform sends actions (tasks) for the specific cloud environment (public and/or private) manager for those to execute the desired action.
The user can follow the result of any of those operation actions in the computing resources almost immediately, it is worth remembering that it is not the uCloud platform that executes the actions, but the environment where the virtual machine is (public and/or private). It is responsible for executing the task sent through the API Rest.
If the result reflects on the user’s screen interface, the destination console can take a while to do this task and only after the end of its execution, the result is presented on the uCloud platform.
There is a menu option where the user can follow the percentage of the tasks” progress, their successful result or the error message regarding some restriction of the destination environment.
It is important to highlight that there can be restrictions applied to the user provisioned on the uCloud platform because they have exceeded the limit of their financial quota or computing resources. This way, the uCloud platform generates an error warning: «quota limit exceeded», for example. These scenarios are described in the Tasks menu.
Infrastructure Operation
The term operate in this context is the user capacity to command certain actions directly in these virtual machines, with the basic operations to:
Shutdown;
Restart;
Suspend;
Delete.
Through the interface of the uCloud platform the user can send commands for the consoles of each cloud provider, besides the actions listed above. It is also possible to view the specific configuration information of the virtual machine, as well as change or add some extra resource to it (for example: network card, disk, security group, snapshot, among others).
Regarding the public cloud service providers, the uCloud platform is prepared to connect with the following public cloud platforms:
Amazon Web Services (AWS);
Google Cloud Platform (GCP);
Microsoft Azure;
IBM Cloud;
Huawei Cloud;
Oracle Cloud Infrastructure.
Currently, the uCloud platform is prepared to connect with the following private cloud environment management platforms (hypervisors):
VMware (vCenter Versions 5.0, 5.1, 5.5, 6.0, 6.7, 7.x or higher);
vCloud;
Hyper-v (Windows 2008R2, Windows 2012, Windows 2012R2 and Windows 2016, or higher);
Openstack;
Xen Server;
XCP-NG;
KVM.
The uCloud platform, besides the CSB (Cloud Service Broker) functions, still is a functionality aggregator that allows the user, in a simple and centralized way, the control of several virtualized environments managements consoles (hypervisors) whether it is from the on-premises private environment as well as from the public cloud providers environment.
It aggregates the monitoring, Cloud Workflow functionalities and makes it possible to implement a library repository centralized of files (playbooks) of reference for the usage of infrastructure tools as a code (Infrastructure as a Code).
Integration and Interoperability among platforms (API uCloud)
Interoperability is the capability to interact and interchange data between two or more systems (computers, means of communication, networks, software and other information technology components) according to a defined method, with the purpose to obtain the expected result. Interoperability defines if two components of a system, developed with different tools and providers, can or cannot act together.
The communication between these «systems» is based on the consumption of an Application Programming Interface (API) that enables the sending and receiving of calls for execution of some activity or extraction of some type of stored information. The API is a set of norms that makes the communication between platforms through a series of standards and protocols possible.
Through the APIs, the developers can establish a communication standard (interoperability) between softwares and applications, that way the API usage expands the capacity of a software to communicate with other platforms.
The main example is the native and direct integration of the uCloud platform with the public cloud providers” console, all of it is executed through the interoperability via providers” consoles API.
Another really common example is the uCloud platform usage is the invoices emission ticketing for showback and chargeback systems, as well as the sending of information and alerts about the managed resources.
Our clients (and/or integrators) can use the API documentation of the uCloud with their internal platforms, in a way to complement or automate certain activities and/or actions that are beyond the native capacities of the uCloud platform.
For example:
Consult and extract from the uCloud platform the values of the invoice costs of a public cloud provider through a financial/accounting application for the invoice emission.
The uCloud has its API documentation, the access to this complete documentation must be requested to your portal provider for it to be created and the access credential sent to the uCloud platform’s documentation.
The Ustore team is ready to help, evaluate the demands of interoperability and integration between the uCloud platform, as well as the applications that have and allow the use of APIs for the interoperability.
uCloud Platform’s Architecture
In the sequence is presented a reference architecture for the uCloud platform with its components, providers and native integrations.
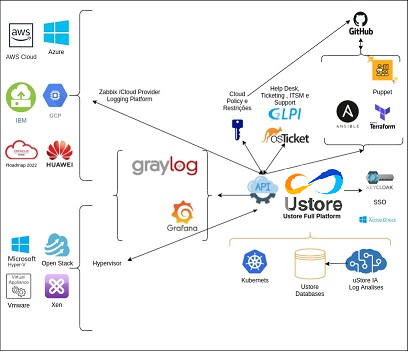
The uCloud platform communicates with the providers console through the API Rest, that way every action executed or configured on the uCloud screens sends actions (tasks) for the specific cloud (public and/or private) environment manager (console) for those to perform the desired action.
The Ustore is committed to maintain the constant development of its software platforms and apply the current IT market DevOps” best practices.
Our commitment regards the integration compatibility maintenance, so the most recent changes and implementations (new functionalities) result in the providers” console and of all the softwares which keep the interoperability. Therefore, the alteration must always be available through the uCloud platform interface.
Ad hoc a set of practices and projected tools are used to increase the capacity of an organization to provide applications and services more rapidly than the traditional processes of software development.
Access to the uCloud platform
Dashboard
Section: Company billing quota
Section: Shortcuts
Virtual Machines
Virtual Datacenters
Billing
Templates
Section: Recent tasks
Section: Quota information about services
CPU usage
Memory usage
Disk usage
Public IPs quota
Virtual Machines quota
Administration Menu
Switch Roles
Switch Roles - Mock Scenario
Mock Scenario (AWS):
Mock Scenario (AZURE and AWS):
Switch Roles - Using
Account
With the addition of this functionality on the uCloud platform, the behavior on the Administration menu innovates by viewing the submenu allocated for Users, Groups, Companies and presents an Account functionality.
This new feature is located on the left side in the Administration menu, below Users, Group and Companies and will be described in detail throughout this document.
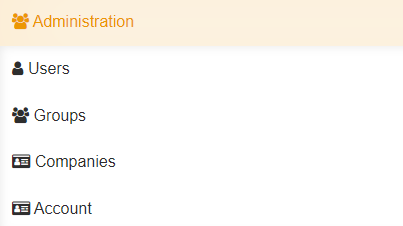
For the user to access this functionality it is just needed to click on the Administration menu > Account.
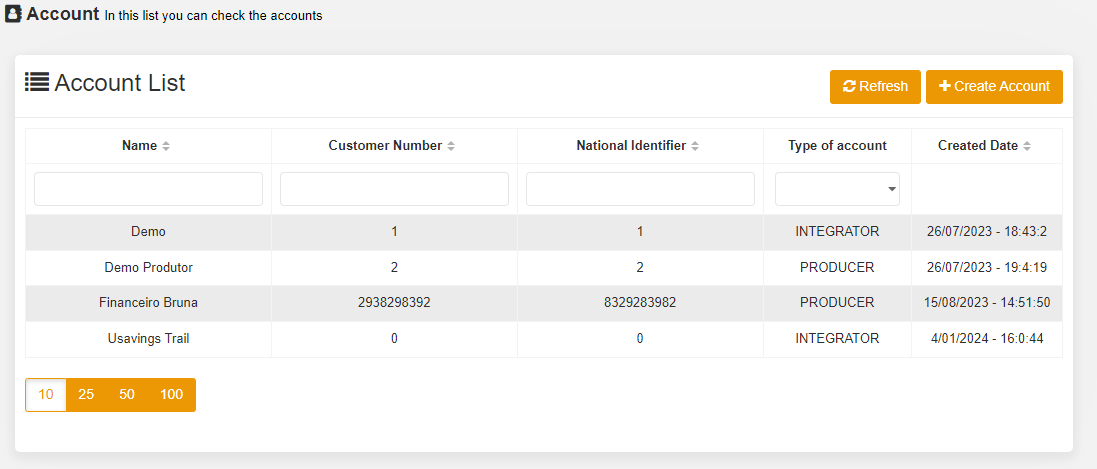
The home screen of this feature shows on the left side the uCloud platform functionalities, below the Administration menu Dashboard it is possible to create Users, Groups, Companies and Account, after creating it it is possible to edit, view, list, among other management activities.
In this example the image displays the Account feature, the user can view on the superior corner the three (3) symbols of: Company, Taks and the username that is logged in the portal. Then, it is possible to view the list of Accounts, the Refresh and + Create Account buttons.
Firstly, before starting the descriptive detail of the behavior and use of this functionality, the concept of Account allocated in the Administration Menu listed after Users - Groups - Contracts will be characterized, the Account functionality can be viewed.
Introduction
The adoption of cloud as a solution to manage the environments of corporate organizations and the combination of private and public clouds is the great management challenge of these hybrid multi-cloud environments.
As previously mentioned in this document, the uCloud platform is developed for this scenario of hybrid environments, independently of how many providers (public and/or private) there are. The user can interact with its Infrastructure as a Service (IaaS), Platform as a Service (PaaS).
In this context, the uCloud portal is positioned as a Cloud Service Broker - CSB platform that allows the management of multiple cloud service providers, as private as the public cloud providers. Consequently, the uCloud platform can be implanted in two different ways:
Dedicated installation (on-premises)
For the dedicated installation scenario (on-premises) the Account functionality may not be applied, once the dedicated installation belongs to a single company, which does not share the uCloud platform between other organizations. Still in this scenario, it can be assumed that the uCloud platform installation will only be used in their own cloud(s), whether it is public or private.
Installation shared as a service (SaaS - Software as a service)
The Account functionality was designed for the shared installation (SaaS) scenario, where the company (named organization) aims to provide the “Cloud Service Broker service” with the uCloud platform, among its various operations (regional or international) for their final-customers (multiples).
The scenario describe above about the uCloud platform SaaS is ideal to the connectivity/communication service provider (organization) which can share the uCloud platform among its regional operations and, also, between its final customers that wish the benefits of operation, financial governance and billing.
It makes it possible to organize and share the resources between the created «Accounts» besides applying service control policies to the users, groups and companies, optimizing the governance.
This new model inserts the layer «Account» in the Administration menu. It represents a new process to promote the alignment around this functionality and, therefore, to conduct the organizations to obtain a greater control of the hybrid environment, in a centralized manner, by its the business rule makes it possible to create the Accounts, and allocate the Companies, the Groups and their Users. Elements belonging to the Switch Roles universe.
The “Account” functionality has as objective to deliver to the organization the viability of segmenting clients per size (virtual machine), per receipt volume (billing costs), assure the performance understanding per “Account” and filter its history by line of business.
To exemplify a way to charge for the “service offering” of Centralized Cloud Management by the uCloud platform, the example of “consumption levels” of computing infrastructure based on the number of Virtual Machines Managed by the uCloud platform, or by the monthly value to be invested, what happens first.
The Tiers represent the existing billing model in the “Accounts” functionality. The business rule created for this model establishes the accounting of the resources obtained and generated by a given account.
In the portal, the Tiers are categorized in levels from A to J (1 to 10) and calculated based on the rules established using two parameters:
Number of virtual machines X Determined monthly value
Number of machines versus Cost/value
For example:
In case of a created account, upon reaching one of the parameters, it immediately scales to the next level. The Tiers level description follows below:
Tier |
A |
B |
C |
D |
E |
F |
G |
H |
I |
J |
|---|---|---|---|---|---|---|---|---|---|---|
Quantity of
Virtual Machines
|
≤ 20
|
≤ 30
|
≤ 50
|
≤ 75
|
≤ 100
|
≤ 150
|
≤ 200
|
≤ 250
|
≤ 300
|
≤ 500
|
Monthly amount |
$1.500 |
$3.000 |
$4.000 |
$6.000 |
$8.000 |
$16.000 |
$24.000 |
$32.000 |
$40.000 |
$64.000 |
Atenção
All quantities and values presented above are merely illustrative, serving only as examples.
Example Use Cases:
Galaxy Company Contract (qty. VMs 20):
In the Galaxy company “Account” there are 20 virtual machines (active and managed by the uCloud platform), therefore it fits in the Tier level “A” - that represents the monthly amount up to 1,500. If it goes past it (and it can depending on the virtual machines and other resources consumptions), the account fits the next Tier.
Nota
In case the account only uses 18 machines, it keeps classified in the “A” Tier charging model - that in the example represents the lowest number or equal to 20 virtual machines and the monthly amount up to 1.500.* (applied according to the company’s established country).
Account Types
There are two classification of “Accounts”, the accounts in the Integrator type and the Producer type, detailed next:
Integrator Account:
This account is responsible for creating the profiles of the integrator and producer accounts, when creating these profiles, it feeds the tiers and the packages, in addition to establishing, the producer account its usage rule.
It works as a kind of cluster, aggregating and categorizing other corporations.
For example:
An Integrator account adds the created accounts., it can be considered an “Integrator Account” for the countries that comprise it: Mexico, Brazil, Chile and Colombia.
The account is responsible for creating other accounts and escalating the other users`. Its has as particularity the list of all the Producer accounts, the companies are associated to the accounts and each one of them receives the same business rules (tiers and packages).
Producer Account:
This producer account belongs to the organization which consumes the resource, represents a minor clustering unit and can operate the entire portal.
For example:
Resuming the example above, this multinational corporation creates the “producer accounts” for the organizations that belong to it within a certain country listed below.
In the case of this Producer Account A Country in Brazil:, the organization broadens the Company of the “A1 Brazil” Client.
In the example, the company uses the account provider/cloud provider AWS Brasil.
The account provider has two (2) VDCs - DevOps Company A1 and NewApps Company A1.
The groups and users are contained in the company (see figure below).
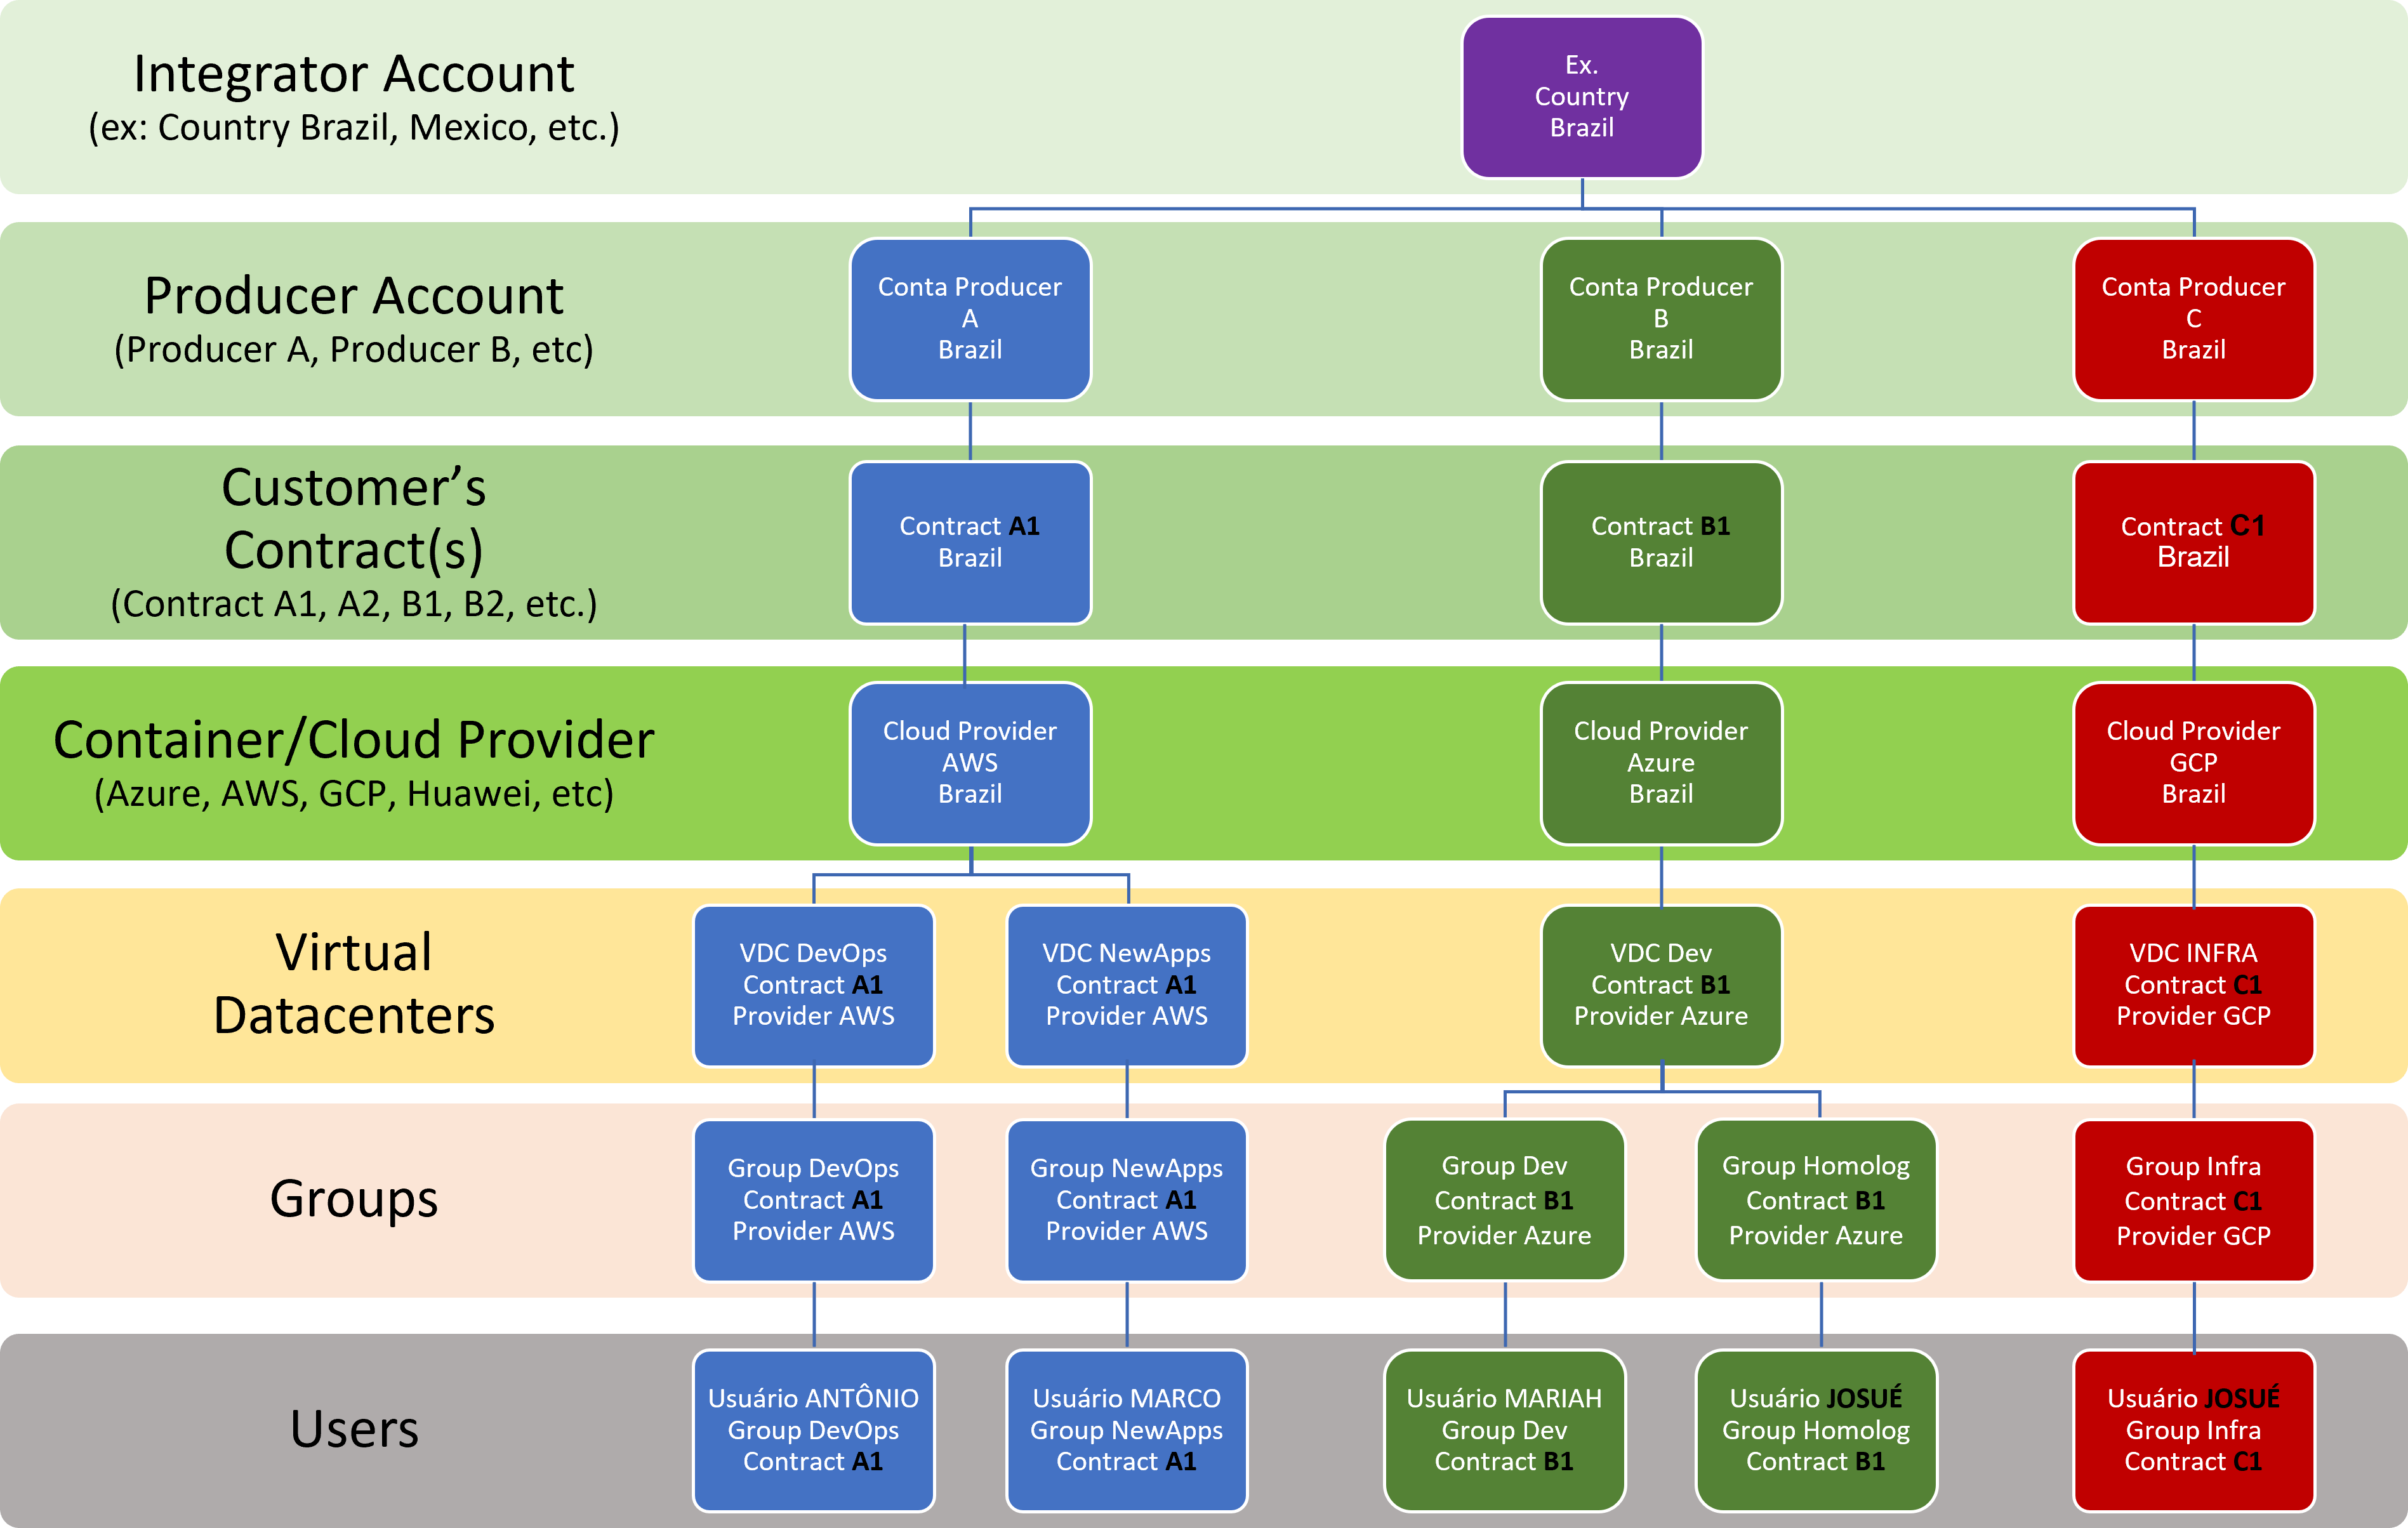
The following illustration is a representation of the Account functionality concept implemented in the uCloud platform. To describe this figure, it is notable the Integrator Account Country Brazil at the top.
The integrator account is [Country Brasil] which englobes the three (3) Producer accounts that are the Brazil Producer accounts: A, B and C.
In these producer accounts, their clients’ companies are allocated. Each company of the client has its virtual datacenter, Groups and Users.
Atenção
All the terms, names, denomination shown in this image are exclusively illustrative, as example.
The accounts of the Producer type can have one or more administrators (in this level the profile of this user is one of System Administrator). The companies stop being created when the corporate resource ends, the viewing and permission profiles obey the business rule applied by the Integrator Account.
The strategy of using the Accounts functionality provides a better perception of value at the level of hierarchy, according to what wants to organize the data, within the context, by facilitating its transit at the operational, managerial and executive levels.
With the creation of this functionality, the administrator can manage the viewing and the permission of each user in each group, contained in a given company. Therefore, the access is denied by default, being granted only when the permissions specify “allow”.
Importante
The activities listed below are restricted only to the users credentials with the permissions of “platform Administrator” ‘role’ function. In case your user does not have this level of permission, please get in touch with your portal provider. By contacting them the authorized team can execute the needed customizations for your environment.
Additionally, the Accounts functionality makes it possible to use the control policies that establish the protection barrier of permission and visualization to the users, depending on the characteristics of the type of user, group and company to which it belongs.
By establishing these default permissions, access and resources visualization, it organizes and qualifies the privilege each user will have within the environment it belongs, creating then permission groups, different and necessary to create thorough controls in each account.
How to Access
Integrator and Producer accounts
Account
Main and Sub-Account
Creating Account
Listing the Created Account
Detailing the Account
Creating Sub-Account
How to view the Accounts List:
Users
Viewing a User
Creating New User
Groups
Viewing Group
Creating New Group
Company
Financial Governance via Company
Computing Resources Financial Isolation
Computing Resources Logical Isolation
Viewing Company
Section: General
Section: Billing Rules
Section: Price Categories
Section: Alerts Policies
Section: Resources Price - Company
Section: Company Quota
Section: Primary Contact
Section: Administrators
Section: Business Data
Section: Conceded Virtual Datacenters
Section: Users
Section: Groups
Section: Billing Data
Section: Permission Profiles
Section: Products
Section: Conceded Permissions
Section: Container Billing Profile
Provisioning Company
Billing Menu
In the beginning of this manual five acting points of the uCloud platform are described, the reader can consult on introduction, the financial governance detailing, services invoicing, infrastructure monitoring, inventory, infrastructure operation.
This section is dedicated to the «Billing» theme, therefore, it is necessary to highlight that this platform does not create or generate computing resources values, these values are generated on the public cloud providers.
The uCloud platform extracts from the billing file the invoicing of these public cloud providers, when downloading the values generated by the usage of the computing resources. Next, adds this information in their internal databases and, after, according to the contract commercial criteria, it can apply these costs calculated and converted for the current Brazil currency.
That way, the user keeps informed about the costs evolution and can follow if these costs are found in the organization’s financial governance criteria. Normally, these costs are presented in CSV (Comma-Separated Values) files generated in each period (average of 8 hours). The uCloud platform adds the information from this file in .csv format in its internal databases, with the objective to speed up and simplify the presentation of these values to the user.
Through the Billing menu, the user can have access to the several viewing forms regarding the costs evolution referring to the computing resources consumption of public network services.
The uCloud platform has an interface for viewing these costs in a ready and finalized manner. It is unnecessary for the user to create or custom whichever of the existing views in the uCloud platform, saved from some exceptions that the report allows to custom the period and some detailed information about the tagged resources. The concept of a report that needs to be sent for paper printing is inexistent. All the visualizations are presented dynamically on the uCloud platform’s screen.
Some information presents on the reports screen, it can be exported for a .csv file and it can be used as base of information for any calculation spreadsheet software (Excel, Google Sheet, among others).
The Billing menu is viewed by any user profile, the environment allows that user to verify and check the monetary values regarding its consumption and public cloud computing resources usage. Next are presented the different types of the user profiles:
Normal Profile User: this user profile views the consumption, its own and its company.
Company Administrator Profile User: this user profile views the information of all groups linked to the company and all users linked to the company.
Group Administrator Profile User: this user profile views the information of the group(s) to which it is linked to and all the users linked to the group.
Other information about the users profile, see in the item Users, in the Administration Menu.
The uCloud platform is developed to attend to a corporate environment as well as a Federal, Estate or City Government environment from Brazil, an environment that has its own characteristics of currency and taxation.
Private Businesses
For the environment cooperative, the uCloud platform downloads the rows from the billing files (also known as bucket) from the cloud service provider. This file is a ASCII text file with data separated by comma (file in .csv format).
The uCloud platform makes the synchronization of this file in its internal databases and calculates the conversion of values regarding the period, using them according to the following fields informed in the Company:
Billing rate;
Currency;
Type of quotation:
(fixed/variable);
Day of the currency quotation:
(valid only for variable quotation);
(the uCloud platform obtains the PTAX value from the Banco Central do Brasil [Brazil Central Bank])
Basically, almost every public cloud service provider stores their value referring to the consumption of computing resources in american dollars (US$).
In the following sequence is shown the way how the uCloud platform must make the conversion for Brazilian Real:
Real Value (R$) |
Value US$ Consumption Total |
x |
Value [Fixed] Dollar |
x |
Billing rate |
Real Value (R$) |
Value US$ Consumption Total |
x |
Value [Day] PTAX |
x |
Billing rate |
Recently, some Brazilian operations of cloud service providers are presenting the values of computing resources consumption already converted for the Real currency, the conversation uses the value of 1 (one) for the conversion tax of Dollar < > Real stipulated by the cloud service provider. That way, the formulas behave themselves as followed below:
Real Value (R$) |
Value US$ Consumption Total |
x |
Value [Fixed] 1,00 |
x |
Billing rate |
It is important to highlight that for the scenario of providers that store tier values in Reais, the Company Administrator must change the blank value of the Currency for 1,00 and Type of Quotation FIXED.
When the user has the uCloud platform connected to a Private Datacenter environment (on-premises), the value by hour of every type of computing resource (CPU, Memory, disk, among others) must be informed individually in the section Resources Price in the contract. The very own company must calculate these values and inform them in the uCloud platform, which calculates the monthly consumption only of the computing resources that have its value informed.
Real Value (R$) |
Value US$ Consumption Total |
x |
Value [Fixed] 1,00 |
x |
Billing rate |
Atenção
 The value refers to the tax rates for the emission of the invoice in Brazilian territory that is not presented by any provider and, also, is not calculated by the uCloud platform. The values of the fees and taxes are calculated by the sender of the final invoice document, the uCloud platform is not an application of fiscal documents emission.
Public Businesses (USN)
Due to the constant variation of the exchange rate value (Dollar < > Real), the Brazilian Federal Government created a smart and facilitated formatation to control their budget limits for computing in public cloud, in a way to never fail to comply the limits of Budget Guidelines Law Bill (PLDO), with the objective to meet in its totality the Law nr. 8.666/93, of 21 June of 1993. For the hired service that institutes the auction - which is a applicable bidding modality to the acquisition of goods and common services - the legal base applied for the hiring of the Federal Public Administration, which must be followed strictly.
It is important to highlight that, in these laws are established the classification criteria of the propositions for the determination of the bidding process winner and of each cloud service provider offers distinct services and commercialization, which makes that a challenge to be discussed; in the definition of the model, the criteria to be used to determine the most vantage proposal for the Federal Public Administration [1].
This approach is unique and special, it allows any Brazilian Government agency (Federal, State or City) to consume computing resources in public cloud allowing that the value of the services in Cloud Service Unit (Unidade de Serviço em Nuvem - USN, in Portuguese) whether calculated using the price in commercial dollar on the auction day, fixed throughout the contract, added to the percentages of taxes, contributions, profit and costs of company divided by the USN value quoted in the auction.
The definition of cloud computing resources values can be individualized and have in the body of each notice (of each public agency interested in the hiring of cloud processing services), this document related to the notice must be followed by an appendix, in which the public agency defines the specific values.
The prices of resources in USN are defined through tags on the Resources Price section in the Company on the uCloud platform, this application makes it possible to add/configure tags that identify every resource listed in the appendix, with the respective value in USN.
Calculation of the resources cost in Cloud Service Unit (USN):
The sum of the quantity used from the resource by the defined price is applied;
In the case of virtual machines, the price is multiplied by the quantity of CPU or by the quantity of memory in GB;
What defines if this calculation will be by CPU or by memory is the tag applied to the resources;
In the case of the inexistence of the USN type tag in the resource, the calculation is not done.
In specific cases of resources with no tags, it takes on the value which comes informed int the Billing file (CSV) of the public cloud service provider.
On this environment, the uCloud platform after downloading the billing file (CSV file) from the cloud service provider makes the conversion of the values regarding to the period, using the values informed in the following fields of the Company:
Billing rate;
Currency;
Type of quotation:
(fixed/variable);
Day of the currency quotation:
(valid only for variable quotation);
(the uCloud platform obtains the PTAX value from the Banco Central do Brasil [Brazil Central Bank])
Therefore, the formula to present the values of the computing resources in public cloud expressed in USN is quite different:
Real Value (R$) Monthly Total |
Resource in USN/h |
x |
Monthly Sum to USN Consumption |
x |
Value US$ [Day] PTAX |
x |
Billing rate |
Real Value (R$) Monthly Total |
Resource in USN/h |
x |
Monthly Sum to USN Consumption |
x |
Value US$ [Day] PTAX |
x |
Billing rate |
Corporate Environment
Before starting the presentation of the reports it is important to clear the concept of Company and its benefits for the businesses, by adopting the uCloud platform as improvement of control and monitoring of the Costs Governance and Computing Resources.
The Company is the main point where the organization user of the uCloud platform establishes the way how to manage the commercial aspects, the financial limits (or the computing resources), it defines the values for computing resources individualized (this is valid only for a private cloud), links groups and the users.
On the contract it is established the way the foreign currency conversion for the local currency (and the value of conversion is fixed or variable) and the tax fees applied to the contract’s costs.
Among multiple aspects of the Company, in the Billing Rules section the administrator of the company can customize the rules of how the company’s cost values can be converted for the local currency. It is possible to custom, if the currency conversion calculation applies the conversion factor: a fixed value or a variable one. For the variable value, the uCloud platform is configured to obtain the conversion value tax directly from the Brazilian Central Bank, where it is possible to extract the value from the PTAX tax regarding the day that is informed on the Company.
On the Company the user selects and defines in which currency the values of all the Billing Reports are presented.
Nota
 It is important to mention that in all the reports screen presented on this document, the values are being converted to Real (BRL).
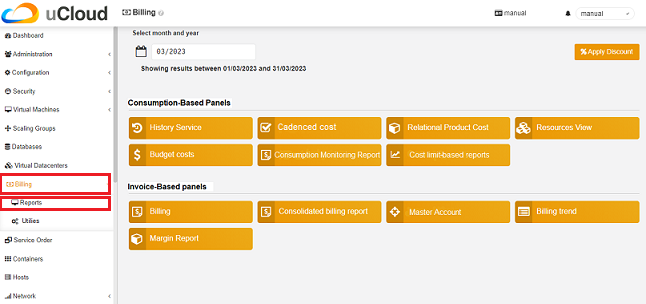
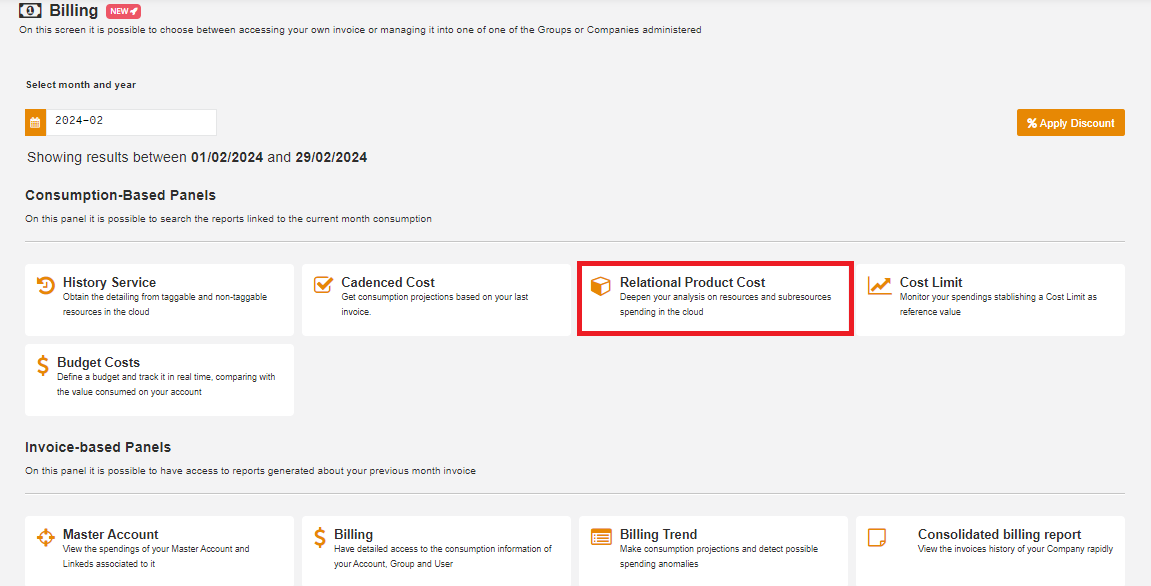
When the user accesses the Billing menu, the uCloud platform displays the screen below:
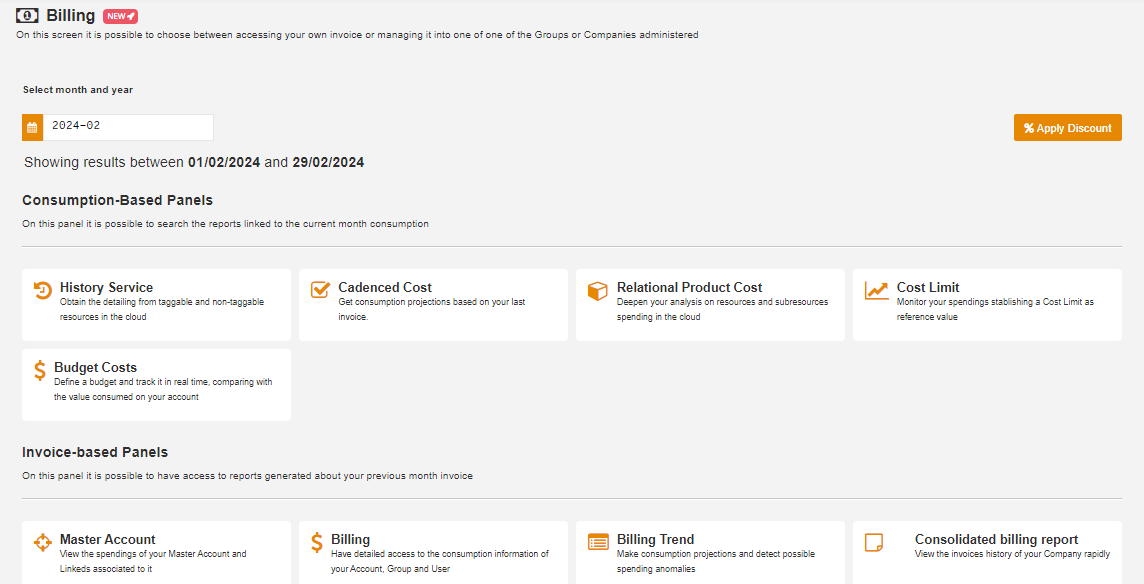
The uCloud platform presents reports based in two different financial concepts:
Consumption-based panels: This set of reports on the dashboard screen refers to the accumulated values of the consumed/used computing resources in the current month until the current day or until the last period (or window) of values processed by the provider.
The term window refers to the period in which the provider makes the recording of the computing resources values on the Bucket file. The average time of this time window is about twelve (12) hours.
That means that it can have discrepancies of values presented, in case the reports were to be consulted, before or after, of this processing window.
Nota
It is important to highlight that the provider does not inform (or makes public) of anyway, the start and end time of its values processing window, therefore the uCloud platform cannot be responsibilized, in case of viewing values that can present differences, even if consulted on the same day.
Invoice-based panels: This set of reports on the dashboard screen presents the total value of cloud service provider (public and/or private) computing resource consumption only from the period of the previous month to the current month. All the consumption values of cloud computing resources (from the previous month) will be accounted for and presented on these reports.
This cost refers only to the accumulated value of the computing resources consumed in the month previous to the invoicing, whose respective billing date is the initial day of the month subsequent to the consumption.
For example:
A contract with the billing and expiration date on the day 8:
Billing from the month of August is on the day 08 and refers to the consumption/used values during all the previous month up to this date.
In the example above, the period: July 8th to August 7th.
This concept is the same applied to the values of the service accounts of services concessionaires, which charges the values of provided services on the previous month.
To illustrate a scenario, in case the field Billing Day whether it is filled with the first day of the month (1), the billing period starts at 0 hours, 0 minutes and 0 seconds of the first day of the month and closes at 23 hours, 59 minutes and 59 seconds on the 30/31st day of the previous month.
Nota
It is important to highlight that the uCloud platform establishes the billing month period with the information of the “Billing Day” field on the Company Billing Rules section.
Billing Rules
Invoice Rules
This new feature is related to the information present on the Billing reports, highlighting that the usage value generated by the clouds and the invoice rule(s) created on the uCloud portal; it has the objective to register any type of alteration made by the user in the rules of the billing sector, besides highlighting the creation and validity date regarding the invoice rules.
Another purpose is to make the access to the registries and information regarding the history of modifications of the invoice rules data easier, which in practical terms makes the user consultation easier, printing efficiency and development to the process of creation, edition or deletion of the invoice rules.
Atenção
In this billing process, the platform has as reference base the value consumed by the user on the cloud and the defined invoice rule. There is no maximum limit for the quantity of invoice rules that can be created in a company.
The available operation for the user are the following:
Add new Invoice rule(s);
View settings and detailing of the invoice rule(s) already created;
Delete the created Invoice rule(s);
Update the listing of Invoice rules.
Accessing the Invoice Rule
To access the Invoice Rule topic, the user must click on “Administration”, located on the functionalities menu on the left side of the screen, and right after click on “Companies”.
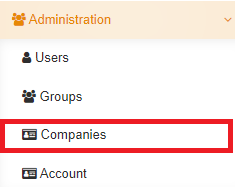
When the user selects this option, the uCloud platform presents the following screen:
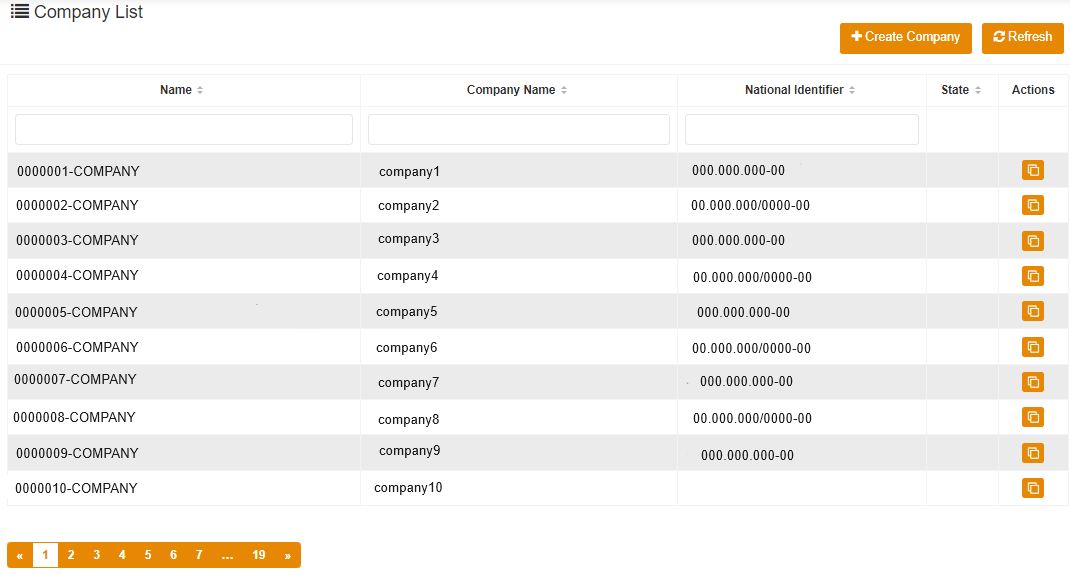
The platform displays a list of all the companies linked to the user that is logged, on the listing there are information about companies names, the administrators, the national identifier numbers (SSN/EIN), the status of the company (active or inactive), and the actions column that makes possible to clone the information of the selected company, the buttons + Create Company and Refresh are also shown on the screen.
To make the search for the user easier, this modal allows the search by the company name, the company can also be found by searching the administrators or the national identifier numbers, it is up to the user to type the information and wait a few seconds.
When finding the desired company, click on it for all the pertinent information to be displayed.
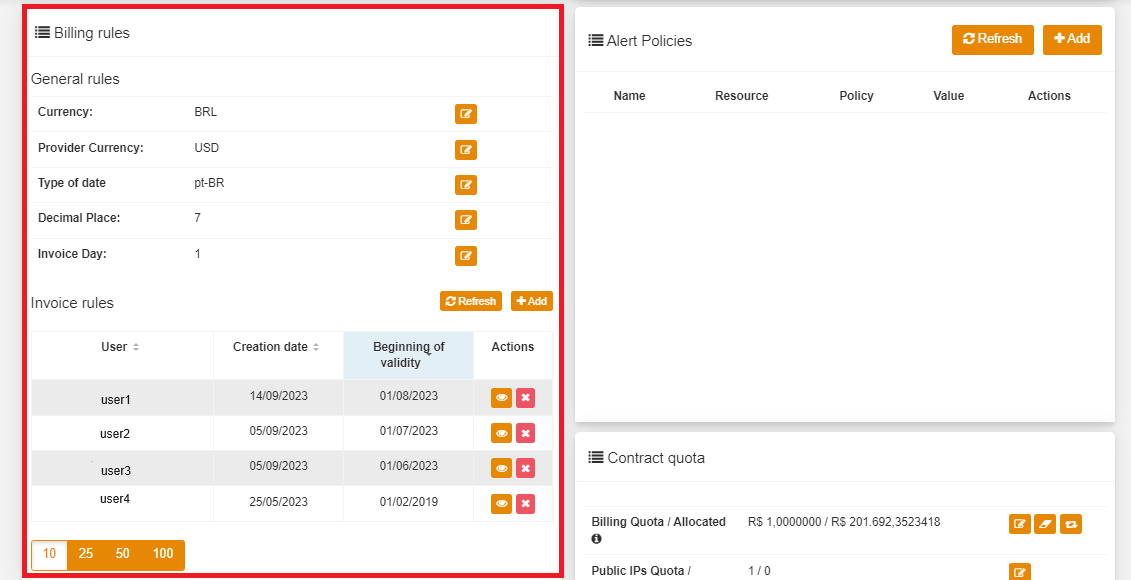
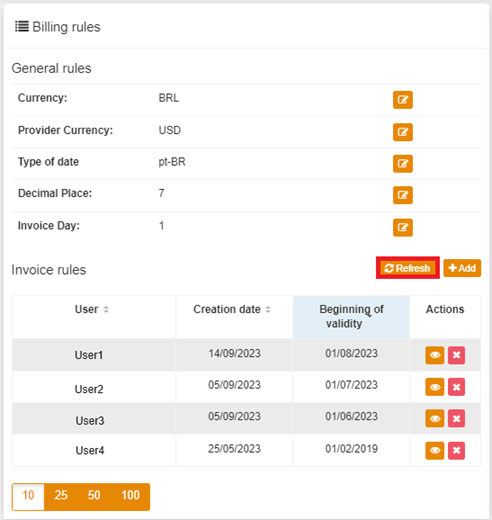
Sliding the vertical bar to the right, the “Billing Rules” card is found, as shown on the image below:
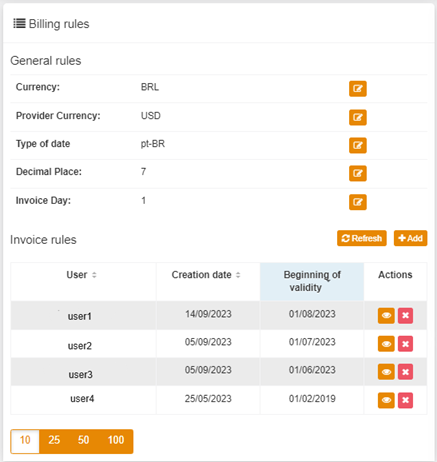
On the card there are the following items:
Currency: the user can select a default currency, the following options are available - BRL; USD; MXN; EUR; COP;
Date format: the user can select the date format, the following options are available - (MM/DD/YYYY); (DD/MM/YYYY); (YYYY/MM/DD);
Number of decimal places: the user can define the size of the decimal places that show in the values on the reports;
Billing day: the user can determine the closing invoice day.
Atenção
For GOV and ETICE clients, besides the items described above, the platform also presents the item Tagging Profile. Exclusive for USN, this functionality allows the user to select a Tag Profile, as shown on the example below:
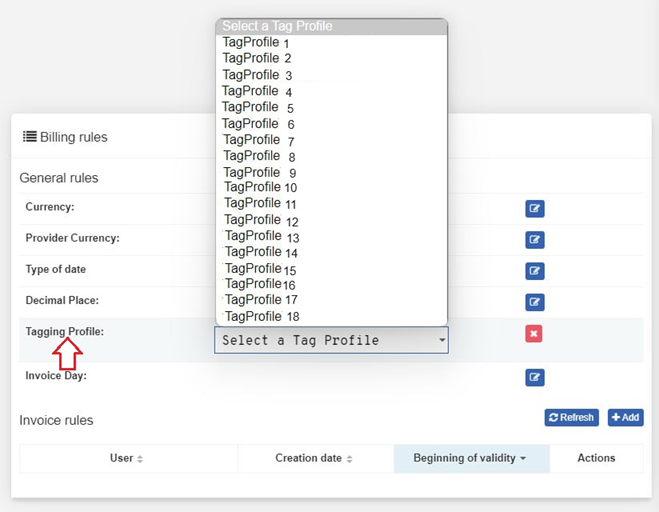
Atenção
Cloud Service Unit (Unidade de Serviço de Nuvem - USN, in Portuguese) is a pricing template of the cloud services, designed to the entities and public agencies integrating the Brazilian governmental sphere. It aims to establish a predictable, linear and flexible method for obtaining a specific quantity charged for the cloud computing services.
Nota
The USN metric consists of establishing a specific reference value for each type of cloud service, according to the individual metric associated with the resource consumption.
Creating the Invoice Rule
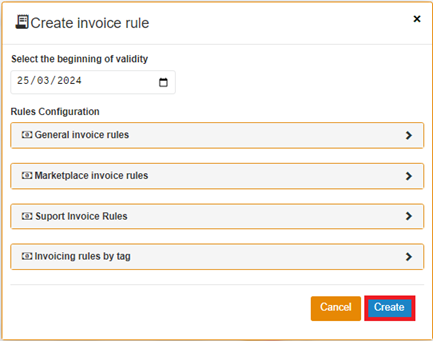
To register a new invoice rule, just click on the button + Add and fill out the settings fields of the “Create invoice rule” modal.
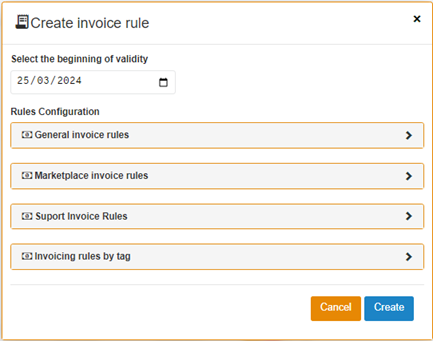
On the modal there are the following items:
1 - Select the start of the validity: the user can define the date that the created rule starts to be valid; when clicking on the icon
 a calendar is displayed for the selection to be made;
2 - Rules configuration: the user can configure the invoice rules from their necessities, they are divided into 04 types:
General invoice rules: refers to the values of the company that show on the Billing reports;
Marketplace invoice rules: refers to the rules applied to the marketplace;
Support invoice rules: refers to the rules associated to the support;
Invoice rules by tag: refers to the rules of values addition to the products that are on the respective Tags;
Createbutton: it must be clicked to confirm the process creation of the invoice rule;Cancelbutton: it must be clicked in case the user gives up on the creation of the invoice rule.
Atenção
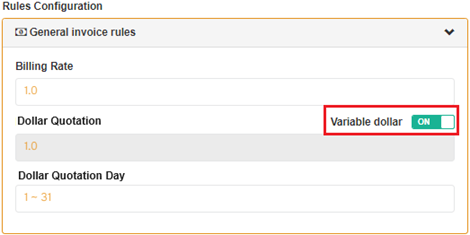
The logic for the billing of the general, marketplace and support invoice rules are the same. By default, all come filled out with the billing rate and dollar quotation fields with the number 1. In case the user wants to change this value, just fill out the field with the intended number.
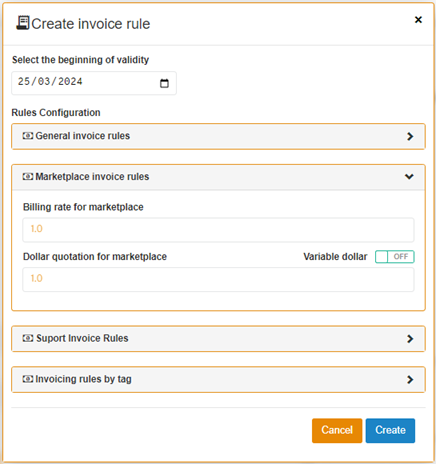
The final value that appears on the Billing reports is obtained through the costs consumed by the user in the used cloud, multiplied by the billing rate determined in the company.
Following the flow when selecting that the quotation is variable if it is necessary to define the day, when establishing that it is not variable the value must be defined.
On the “Invoice Rules” (General, Marketplace and Support), the dollar already comes enabled as fixed, in case the user wants to substitute it, they must click on the flag Variable dollar leaving it on the “ON” option (according to the image below), in this moment a new blank is shown and makes possible the filling with the intended date for the dollar quotation.
Invoice Rules by Tag
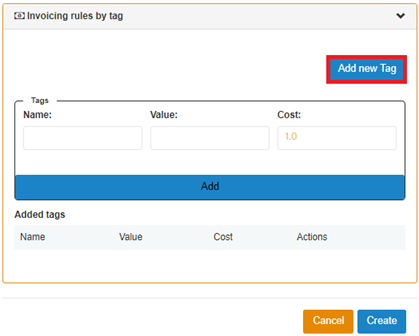
In the last blank named as “Invoice rules by tag” the platform shows a modal that makes it possible for the user to include Tags to the invoice rule(s) created, registering fixed billing rates by Tag (e.g.: Tag “A” with value X; Tag “B” with value Y).
Nota
In case there are no Tag registered with a specific value, the platform uses the value from the regular billing history, tied to the company.
By selecting the Add new Tag button the fields shown are:
Name: it must be filled with the Tag name;
Value: it must be filled with the key/value of the Tag to be added;
Cost: it must be filled with the cost to be inserted about the Tag that is being added. By default it presents the number “1,0”, in case the user wants to change the value, just type the desired number on the field, or use the auxiliary arrows to increase or decrease the number.
Once the respective fields are filled with all the necessary information, the Add button must be clicked for the platform to display the list of Tags associated to the invoice rule that is being created.
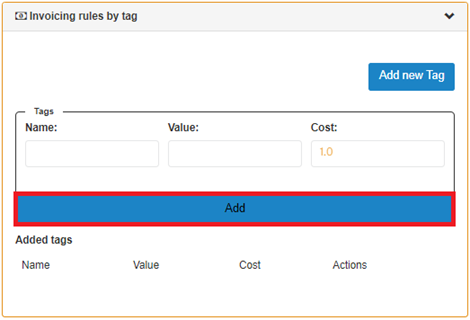
Besides the information corresponding to the name, value and costs specified previously, a column of actions is shown, where the user can delete the Tags that are presented on the list, to do that just click on the deletion button  :
:

Concluding the filling of all the information, the Create button must be clicked (highlighted on the following picture):
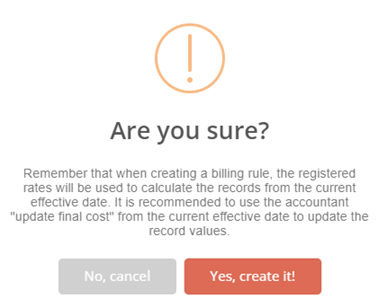
Done with this action, an alert message is displayed by the platform, reminding the user that when creating a new invoice rule the fees registered are used to make the calculation of the registry from the validity date.
By clicking on Yes, create, a warning message is shown on the superior right part of the screen, on it there is the creation of the rule that is being processed.

List of Invoice Rules update
Once the creation process is done, click on the Refresh button located on the “Billing rules” modal, this operation allows the renovation of the list of invoice rules created for the company. In the modal there are columns allusive to the username responsible for the invoice rule creation, the creation date, the start of the validity and an action column with two buttons.
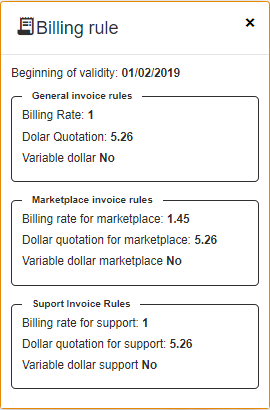
One of the action buttons that can operated is the details one, represented by the icon  , and the exclusion one, represented by the icon . When clicking on the details option a card is presented and on it there is all the data and the values of the invoice rule selected (general, marketplace and support invoice).
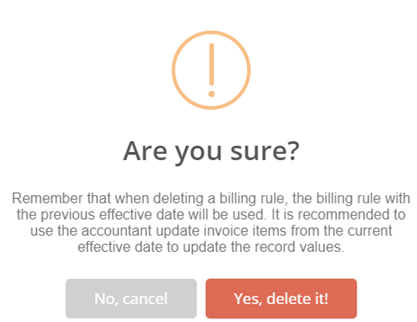
In case the user wants to delete one of the invoice rules created, when clicking on the exclusion button an alert message is displayed:
Finally, the listing of the invoice rules created can be customized and present the information retrieved in blocks of 10, 25, 50 or 100 lines, according to the needs of each user.
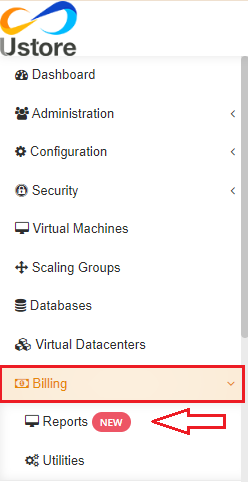
Reports
In this flow, the following image is presented to the user when the Reports submenu is accessed:
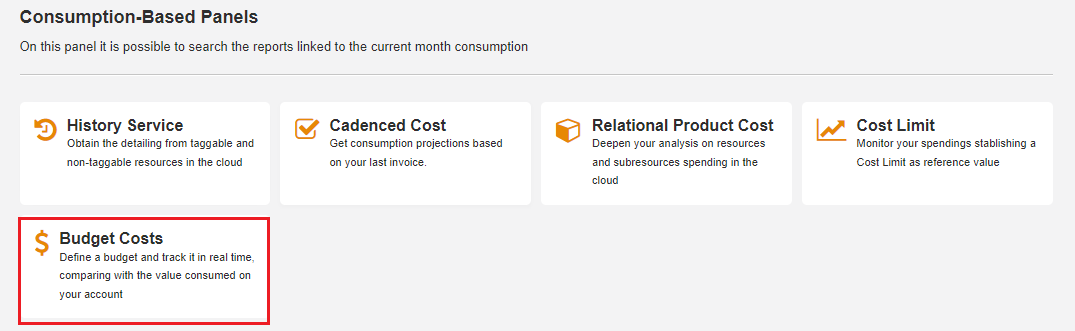
Consumption-Based Panels
In this flow, the following image is presented to the user when the Reports submenu is accessed:
As mentioned, this cost regards to the computing resources consumption accumulated values in the current month up to the current day or up to the last “window” of values processing through the provider. It is presented a set of reports:
Service History
Cadenced Cost
Product Relational Cost
Resource Viewing
Budgets Costs
Consumption Monitoring
Cost-limit based
Service History Report
This report allows the costs administrator to follow the evolution (monthly, weekly or daily) of the costs of each Product Name registered on the public cloud service provider. These costs are separated into costs with and without tags.
The tag resource is the most usual and indicated way by the public cloud service provider so that the companies can apply some identification to their recurrent public cloud infrastructure costs. Each one of the providers have its specific characteristics of which services or products are not amenable (it is not allowed) to apply tags, in other words won’t be all their services and products that can get a tag.
The characteristic of not allowing to link tags in all their products can take the companies to a conceptual mistake for the application and distribution of costs by department, costs centers, projects or any other application for the tags.
Therefore, the uCloud platform presents, discriminates and segregates the sum of the values of each Product Name of the public cloud service providers, in a way that the businesses’ cost administrator can correctly identify the total with and without the tags.
On a FinOps work approach it all starts by identifying which are the resources with more consumption. In that case, the service history menu, the client can view the list of the resources that are consumed the most in their invoice. They are grouped by Product Name and by Product Family.
When selecting the menu option SERVICE HISTORY it is requested to choose a Company, in the sequence of the type Frequency and Period, through this report it is possible to analyze the costs in detail, as presented on the images below.
By selecting this report, the uCloud platform presents the screen below, where the user must inform or select a single company:
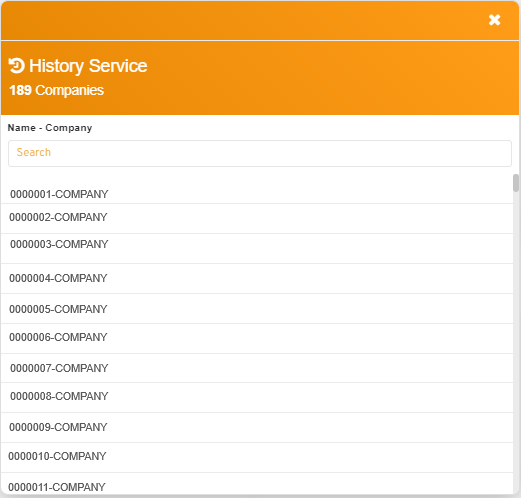
Company: The uCloud platform presents a list with only the companies which the user is linked to, they must inform or select only a single company per time. When selecting the desired company the uCloud platform presents the screen below:
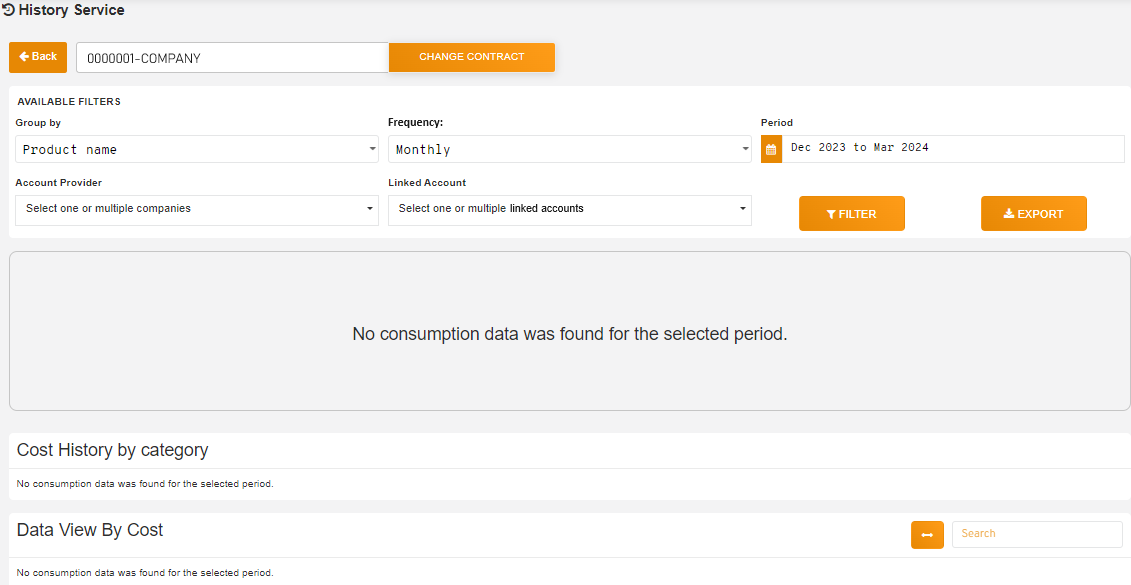
Below follows the description of the fields for this report presentation:
- Frequency: This field is the dropdown type and the user can select the ideal period to evaluate the consumption data in their environment. When making a comparative monthly analysis the client can understand how their invoice evolves throughout the time, according to the provider’s invoicing. By clicking with the mouse cursor on
Frequencythe uCloud platform presents the options: Monthly: Once selected the monthly analysis, the client can understand how their invoice evolves throughout the time, according to the provider’s invoicing.This view allows them to understand the consumption of the products according to the client’s invoice.
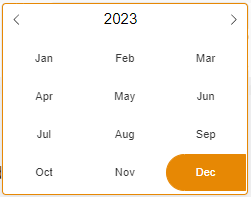
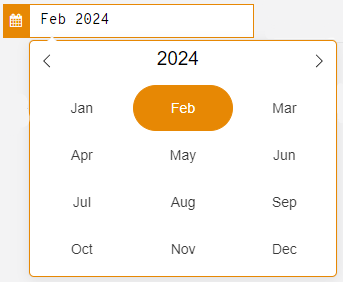
In the example below, when selecting the
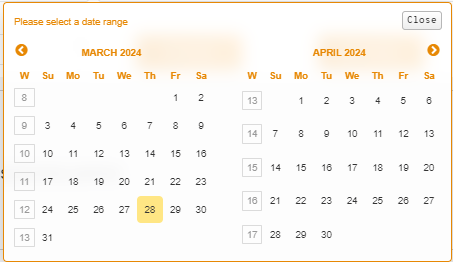
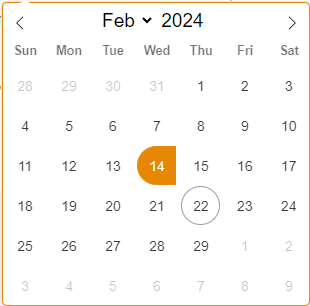
Periodblank and thenMonthly, that way, the calendar with the months becomes available for selection. It is possible to choose the minimum of 1 month and the maximum of all the months of the year. To exemplify, the last three months were selected according to the image below.
- Frequency: This field is the dropdown type and the user can select the ideal period to evaluate the consumption data in their environment. When making a comparative monthly analysis the client can understand how their invoice evolves throughout the time, according to the provider’s invoicing. By clicking with the mouse cursor on
Weekly: This filter allows one to have a more granular view of the consumption, making possible the understanding and identifying consumption peaks in weeks throughout the months. In that case, it can generate indicators of applications or behavior that generate consumption peaks in a certain week and, not in another.
It is important to mention that in the present moment the uCloud platform works only with the concept of closed weeks of the month (Sunday to Saturday), these weeks are numbered sequentially from 1 to 52 and presented on the left side of the presented calendar. The blank
Periodshows theWeeklycalendar. According to the image below:
Daily: This filter allows a view in a less granular period possible. Thus, it is possible to understand and identify consumption peaks throughout the days. In that case, it can generate indicators of applications or behavior that show consumption peaks in a certain day and not in another. The
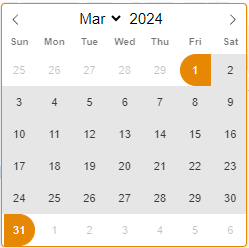
Periodblank shows the calendarDaily. As shown in the image below:
Period: It is a mandatory field, the uCloud platform changes this blank, after the user selects the period on the previous space.
Account provider: This field is mandatory and dropdown type, when the user clicks with the mouse cursor the uCloud platform presents the list of all the provisioned containers, which the user is linked to use.
Linked Account: The term “Account provider” on the uCloud platform is used to represent a cloud environment, whether it is public and/or private. An account provider is a logical abstraction to group all the resources (virtual machine, servers, disks, storages) of a certain type of hypervisor. All the providers adopt a logical organizational structure to create their totalization costs environment.
For the uCloud platform, an Account provider is provisioned that can be the “root” of the business. The uCloud platform denominates a “Sub Account” the subdivisions of this main account (Organizational Units or Member Accounts, among others), allows the businesses to allocate cloud computing costs for different units or cost centers. This is a dropdown type of field and lists all the Sub Accounts that were provisioned for the root account, according to the following example, on the image below:
Filterbutton: The user must click with the mouse cursor over thisFilterbutton after the complete filling of all the desired filters, at this moment the uCloud platform processes the information stored in its databases and presents the reports on screen. Below is presented a screen to illustrate as a simple example the result after the processing to display the report:
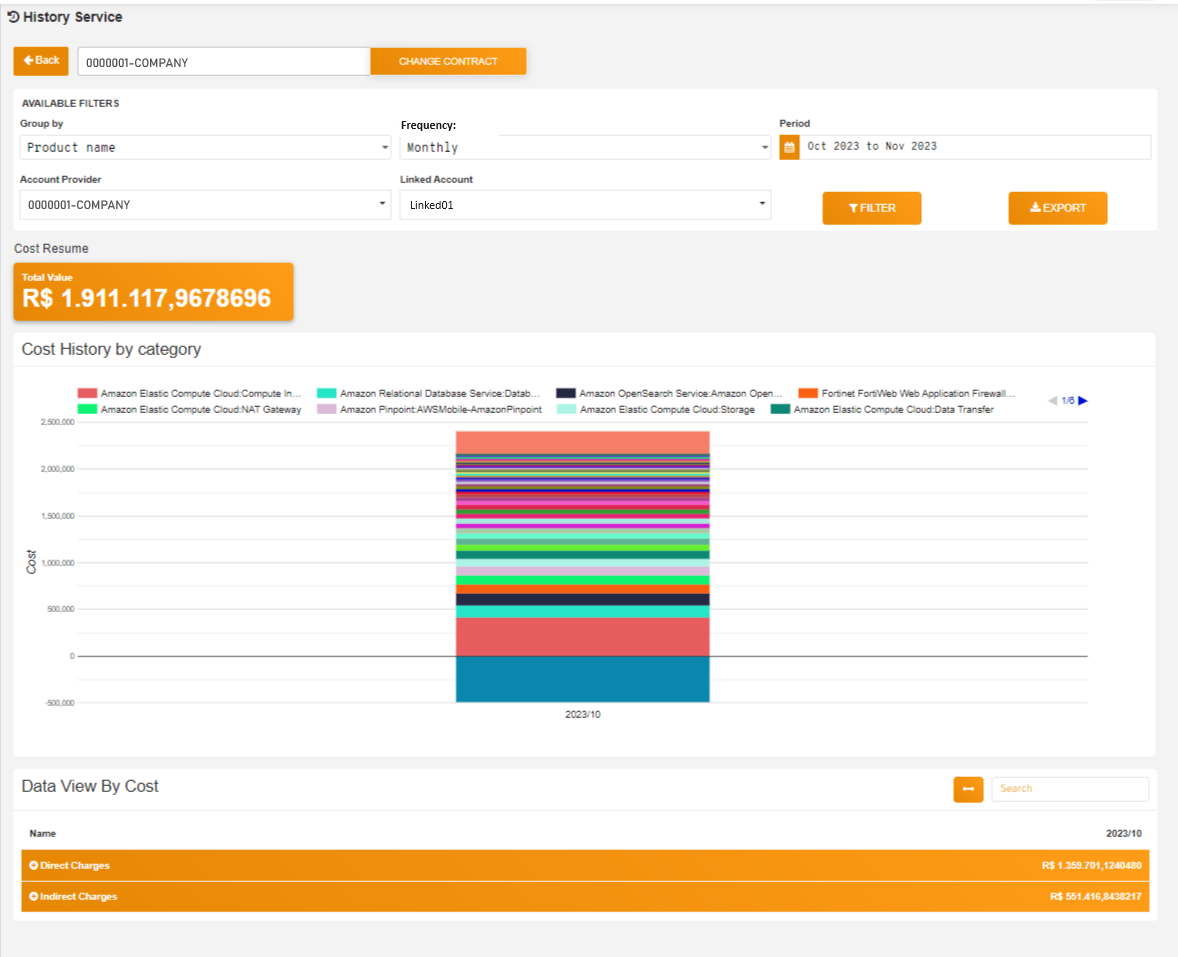
In the Service History there is the quadrant “Total Value” that presents the cloud consumption on the month selected on the filters fields.
With that information it is possible to have a visibility of how the environment is behaving, therefore, the user can start to put together a strategy to discover forms of optimization.
In the sequence, a deep view of how these expenses are distributed among the cloud products.
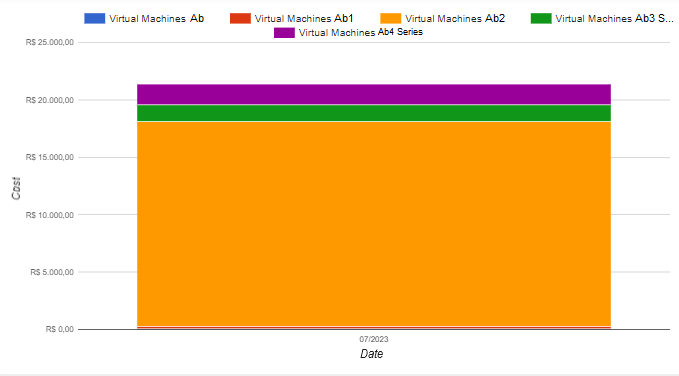
Section Charts Cost History by Category:
In the quadrant “Cost History by category” the panel displays a chart for every month selected and the list of all the cloud services, referring also as Product Name respective of each public cloud service provider.
Following the pattern of nomenclature of each one of the clouds, the bars show how much was spent and how much the service represents the total consumption of the invoice. By passing the mouse over the bars the panel presents the name of the product and its respective expenses, as shown on the image below:
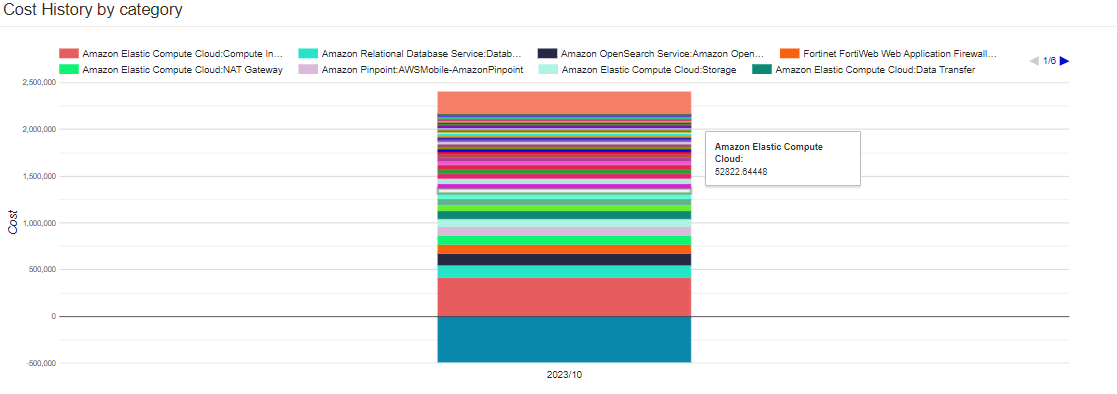
The default presentation of these graphs by the uCloud platform is the stacked columns chart, with the value separated for each Product Name of the public cloud service provider.
Graphs Settings: it is an existing tab on the inferior part of the screen which the user can customize the way of presenting these graphs. The user just needs to click with the mouse cursor over the tab that the uCloud platform presents the settings options:
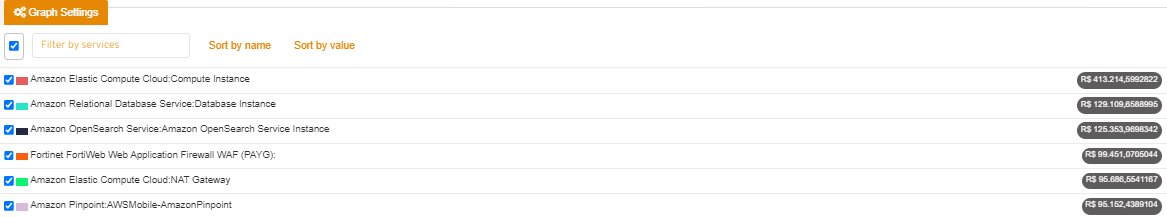
On this tab the user can select if they desire to present or remove from the graphs any Product Name of the public cloud service provider.
Section Viewing Data by Cost:
In the quadrant viewing data by cost, the panel presents the service items (PRODUCT NAME) and net to it the months chosen with their respective total expenses separated into two categories, DIRECT CHARGES and INDIRECT CHARGES, according to the illustrative example on the screen below:
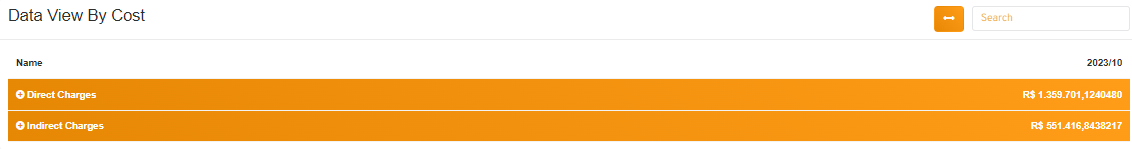
Direct Charges: The
Directcategory is the sum of the values of all the products and/or services which the public service provider does allow to link some form of identification, or tag, that when linked to the computing resources by the owner of the resource(s) it is the most usual way for identifying and allocating the recurrent values between departments, cost centers, projects, initiatives.Indirect Charges: The
Indirectcategory is the sum of the values of all the products and services that the public cloud service providers does not allow that any type of tag to be used to link to the computing resources by the owner of the resource(s). Each public cloud service provider has its specificity in which products and services the tags are not amendable of being linked.
The explicitly segmented and presented information on the form of this report can support the decision making (insights) to align the distribution of the costs internally on the company (chargeback). This presentation is supported on the best FinOps practices for the correct identification of the recurrent costs of computing resources in the public cloud.
Nota
It is not the objective of this report to present the respective tags in the body of the report, but to present to the costs administrator the total of the values which will be possible to identify the department, costs center, project that are attributed through tags. The uCloud platform allows the cost administrator to consult the values by tag in several other billing reports.
Cadenced Cost Report
Product Relational Cost Report - PRC
This report allows to view the cost of each service separately within a selected company, in it it is possible to follow the evolution (daily, weekly or monthly) of the consumption detailed costs of every Product Name and its respective Family Name (subresources). The great benefit of this report is to analyze the real cost composition of a certain resource, presenting with details the values of its subresources distributed in the selected period.
Atenção
The uCloud platform synchronizes and unifies the data original source from the cloud provider service in its base - the billing file from the provider, then this report enables the same view, independently of how each public service provider identifies (names) their products and sub-products.
Nota
 This report allows the user to analyze the individual cost of each Family Name of only a Product Name per time.
This document, aiming for the best experience of the reader user, the Product Relational Cost Report is mentioned from here on now as “PRC”.
Accessing PRC Report
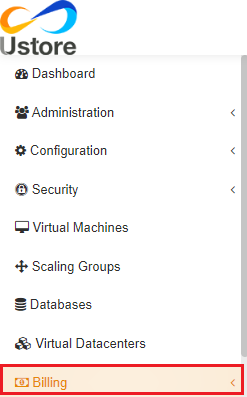
To access the PRC, the user must select the Billing menu located on the left side of the platform, and then click on “Reports” or “Reports New”.
When the user selects this option, the uCloud platform presents a screen divided into two groups, “Consumption-based Panel” and “Invoice-based Panel”, the PRC report is found in the first group, to access it it is necessary to click on the Product Relational Cost option (highlighted in the following image).
After this option is selected, the initial screen of the PRC report is displayed, allowing the user to deepen their analysis in the detailed data generation of the expenses of resources and subresources.
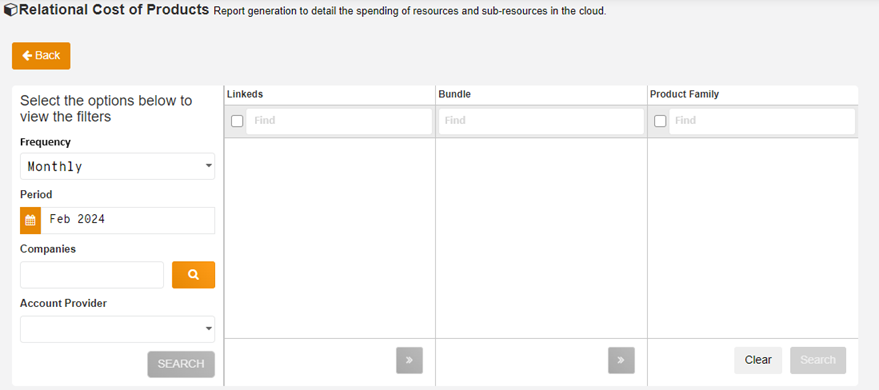
In the image above it is possible to observe the following action fields:
Backbutton: The user can return to the previous screen (Reports from billing menu) at any time;Frequency: This is a drop-down field type and the user can select the ideal period to evaluate the consumption data. By clicking on this option the uCloud platform presents the following periods:
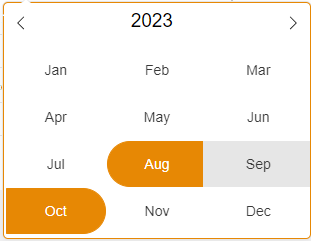
Monthly: The client can understand as their consumption evolves throughout the time in a broad way. It is possible to choose from one to all of the months of the year. To exemplify, 3 months are selected, as shown below:
Weekly: This filter allows a granular view of the consumption, in which the user is capable of understanding and identifying behaviors that generate consumption peaks in certain weeks throughout the months. It is important to highlight that in the present moment the uCloud platform works only with the concept of month’s closed weeks, and these are numbered sequentially from 1 to 52, presented on the left side of the calendar. According o the figure below:
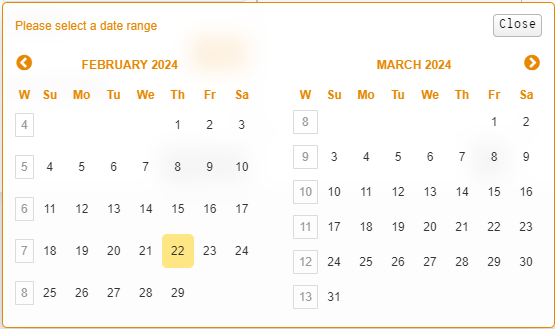
Daily: Allows the user to view the consumption in the lowest granularity of period possible, helping to understand and identify the behavior that generated consumption peaks throughout the days. The platform presents a circle to set as the current date (on the example below 02/22/2024).
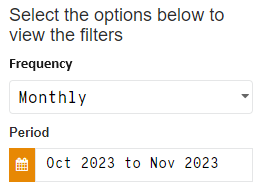
Period: After selecting the frequency and choosing the dates to be filtered, the platform displays the period indicated by the user for the production of the report at hand. In the example below, for a monthly frequency, the months selected are October and November.
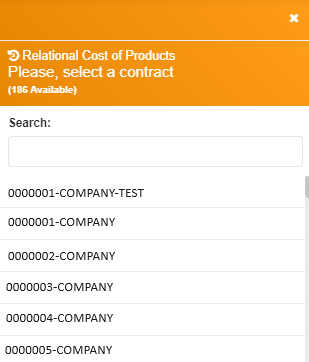
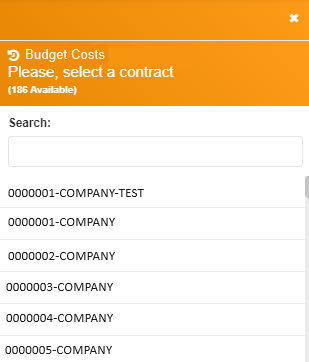
Companies: By clicking on this field, the platform shows a modal with the list of companies associated with the credential logged in the platform (in the example presented are 186 available companies), it is up to the user to decide which of them will be selected to generate the PRC report. It presents only the financial information regarding the selected company. The user can use the search bar located on the right part of the modal when necessary, or use the blank “Search”.
Magnifying glass button
 : This button presents the same purpose of the “Companies” functionality. If the user credential has an active session associated with more than one company, when clicking on the magnifying glass icon the platform presents the modal with the list of available companies for the report emission.
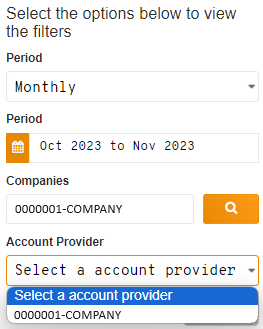
Account provider: This field is mandatory, after the frequency, period and company are selected, the platform presents the list of all the account providers provisioned which the user is linked to. Once the account provider is selected the search button is available for using.
Nota
The platform shows the Account provider options according to the existence of information that has already been billed for the frequency, period and/or correspondent company. In the inexistence of data, the platform displays an alert message in the superior right side of the screen, communicating that it was not possible to find the account provider with consumption registered for the selected period.

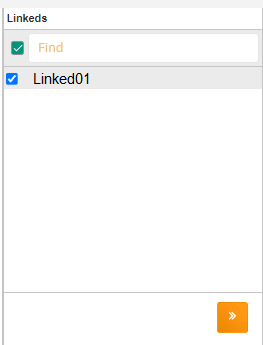
Searchbutton: Initially this button is displayed as disabled, only being enabled after the frequency, period, company and account provider are selected. The user must click on this button to follow the flow of data obtention for the report.Linkeds: This field is a check mark type, after clicking on the
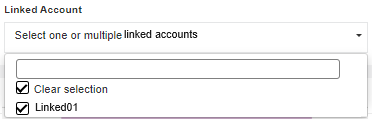
Searchbutton the platform presents the list of all the Linkeds - Sub accounts that are part of the account provider(s) that are linked to the company. At this moment the user must select one (or multiple) Linkeds. To facilitate the search it is possible to type the name of the Linked on theFindfield.
Nextbutton : The user must click with the mouse cursor on this button to follow to the next blank of data filtering. In case this button is disabled it means that there is no operating selection for this filtering field. This button is also viewed in the “Product” blank presenting the same functionality.
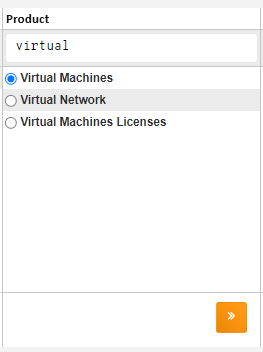
Product: This field is radio button type, on it the uCloud platform presents the list of all the Product Name that are part of the billing file (CSV) that is synchronized with the internal database. The user must click on the desired product, then it is allowed to click on only one Product Name. To facilitate the search it is possible to type the name of the intended “Product” in the blank “Find”. On this field there is also the button
, initially it is displayed as disabled, after selecting the “Product” it is enabled, the user must click over it to follow to the third and last data filtering field.
Product Family: This field is check mark type, the uCloud platform presents the “Product Family” list that is linked to the “Product” selected in the previous blank. The user can select all the items presented or just those that are in your interest to obtain the report (see example below).
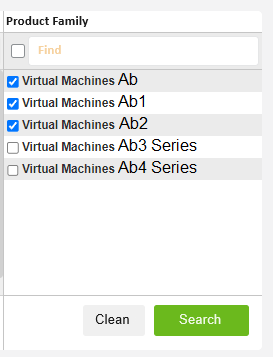
To facilitate the search, it is possible to type the intended“Product Family” name in the “Find” blank. The “Family Product” field presents two buttons Search and Clean explicit next.
Cleanbutton: The user must click on this button when they need to redefine the filtering fields. This is the default procedure indicated to the user when they need to generate the report with new data.Searchbutton: After selecting the options from the “Family Product” field, the user must click on this button and the uCloud platform generates the report. Initially it shows as disabled, when clicking on at least one of the “Family Product” options the button is enabled.
Obtaining PRC Report
As explained previously, to facilitate the understanding of the user reader, it is reinforced that: to access the PCR report the user clicks on the billing menu on the uCloud platform, chooses the consumption-based panel and opts for the Product Relational Cost report. Once selected the frequency, period and company, the user must choose the account provider, so the Linkeds can be displayed. Therefore, the user needs to pick the product, right after selecting one or multiple of the options shown in the “Family Product” field.
Doing all this flow in which the user informs the credits needed for the elaboration of the report they must click on the Search button, as result the platform presents a new board with all the PCR report data (example below).
Nota
This report does not allow data exportation. All the information is presented on the platform.
In the sequence the description of the elements that compose the PCR report:
Select a Linked: In this board the user can alternate the way of how the uCloud platform presents the report data. This section presents to topics:
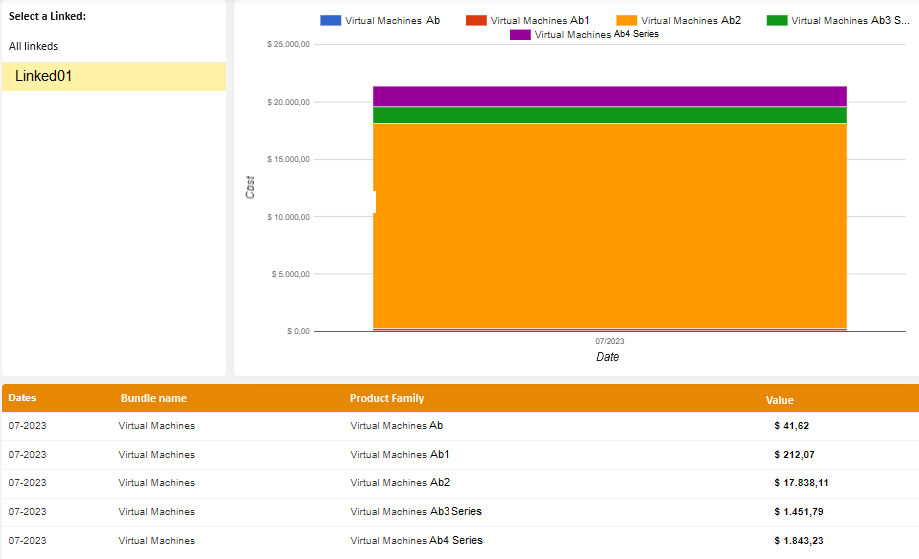
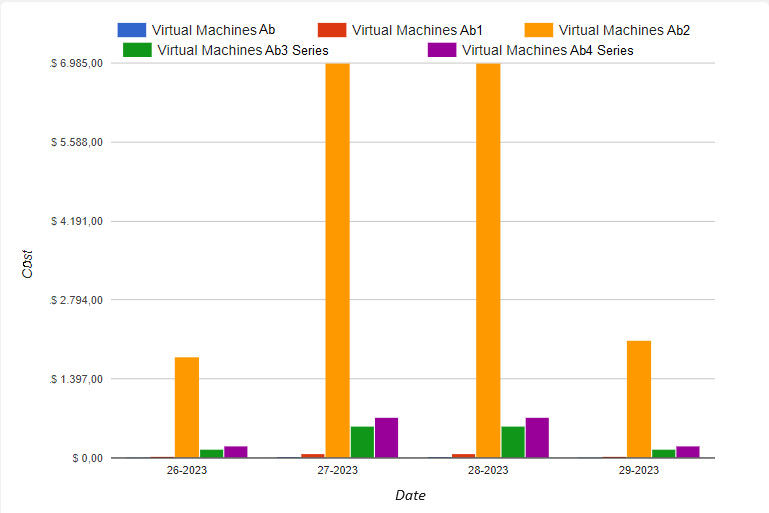
All Linkeds: One of the display options of this report, is the presentation of a bar chart of the type Dates x Cost, with the representation of the total sum of the values of each Family Product. To facilitate the viewing and interpretation of the report data, the uCloud platform shows the subtitle of the graph in distinct colors in the superior part.
Select only one Linked: It is also one of the display options of this report. When clicking on one of the Linkeds presented, just like the previous section, a bar chart of the Dates x Cost type is shown with the representation of each Product Family for the specific linked. The example below displays the chart in the weekly frequency. In this section, the platform also presents the subtitle of the graph separated by different colors in the superior part.
The last part of this report is about the information table, which has an objective to help view and interpret the data. Although they look similar, they are distinguished by small differences in each one of the tables, corresponding to the sections All Linkeds and Select only one Linked.
Table of the sections “All Linkeds” and “Select only one Linked”.
As aforementioned, these tables are part of the PCR report and are visible to the user after the report generation. On the All Linkeds table (superior table) there are 4 columns, they are: Linked, Product Name, Product Family and Value. On the other table Select only one Linked (inferior table) there are also 4 columns: Dates, Product Name, Product Family and Value. In the sequence are detailed examples and the descriptions of each of these columns.
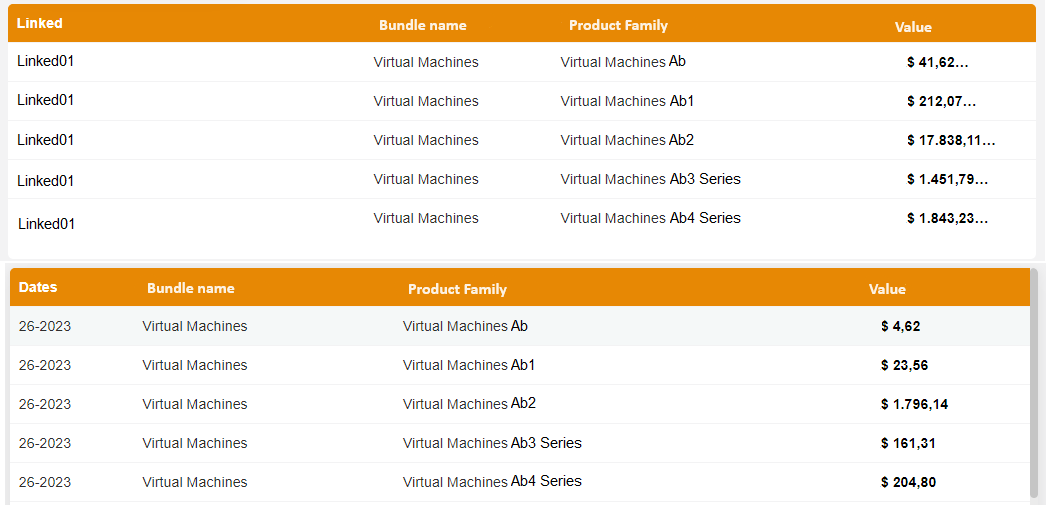
Linkeds: This column shows a list of all the Linkeds that were selected in the report elaboration, it is presented only on the table of the section All Linkeds;
Dates: This column is exclusive for the Select only a Linked section and presents the specific values for each Family Product, according to the selected period and their respective dates. Included in the filter a broad date sequence, as default visualization the platform presents the respective column in ascending chronological order, the user can modify/invert this display clicking on the “Dates” column;
Product Name: On this column the platform presents the Product Name that was selected in the filtering field; according to the example presented, this column is present in both sections;
Product Family: This column lists the Product Family(ies) selected in the filtering field, according to the exposed example, this column is present in both sections;
Value: On this column the uCloud platform shows the sum of the costs regarding the selected period.
Nota
When clicking on the table on the Value column it is possible to order the highest value to the lowest or vise-versa; but when clicking on the Product Family column it is possible to verify that the information can be displayed in alphabetical order or inverted.
This report has great importance in business intelligence, because it can help the user and/or the Costs Manager in the data interpretation, as well as in the detailed viewing of information. The PCR report helps in the Budgets predictions (Predicted vs. Made) that were not very clarified, due to the complexity of the billing file (CSV) analysis from the public cloud provider, mainly when there are several Linked Accounts in the billing organization scenario.
Resource Viewing Report
Budgets Cost Report
The Budget is a report based on consumption created with the objective to define a total budget for a certain period (named as Frequency), whether it is monthly, quarterly, semiannual or annual. This consumption-based report, besides defining a total budget, allows viewing the Budgets costs in detail.
It’s a new uCloud implementation, defined by a report based on consumptions that aims to fix the total budget for a period and enables cost predictions.
Accessing
To view the Budgets Costs Report, the user must access the Billing Menu, located on the left side of the screen.
A list of submenus is displayed, and it is necessary to click on the Reports option, evidenced on the image below.
On this flow it is presented the Billing menu screen, where two classes of panels based on consumption and invoice are shown.
The first topic “Consumption-based panels” group different types of reports, they are:
Service History;
Cadenced Cost;
Product Relational Cost;
Cost limit;
Budget costs.
The budgets costs button presents a brief description of its function.
When clicked, it presents a “Budgets costs details” screen.
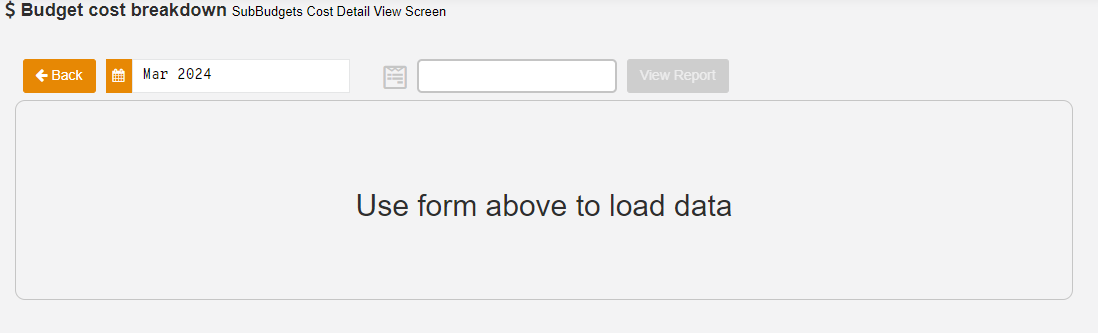
The screen above shows:
Backbutton: Allows the user to return to the billing reports home page;Calendar: In this field it is possible to select the desired period, it is also possible to go through months and previous years.
Company choosing field: This area presents a modal to pick the desired company, the search is facilitated by the search and roll bar:
View report: Searches the report regarding the period and company previously selected.
When clicking on the button mentioned above, the screen with the budgets costs details is presented:
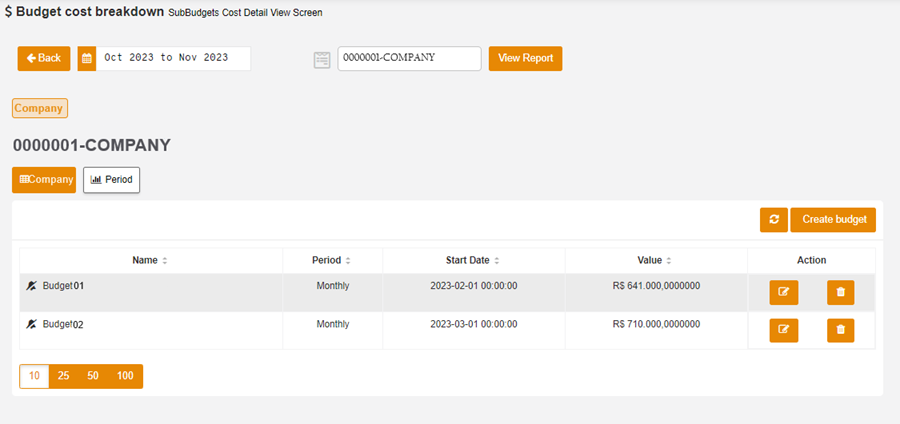
It presents two types of listing:
Company;
Period;
Displays two buttons:
Update icon;
Create budget.
And allows to execute two actions:
Edit;
Delete.
Creating Budget and Sub Budget
To start the creation process, the user must click on Create budget.

Then, the creation modal is presented:
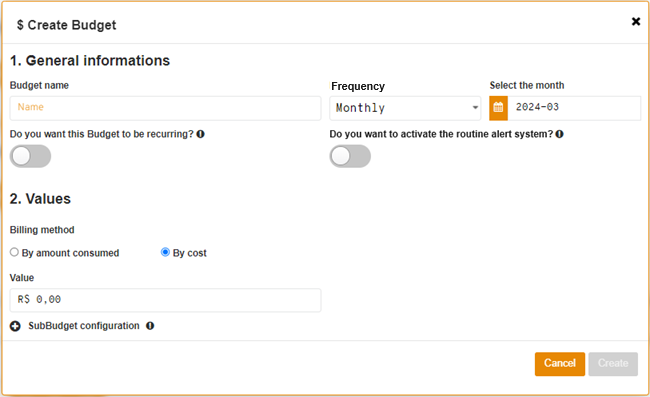
Below the blanks shown in the figure above are described:
1. General information
Budget name
Frequency: Dropdown menu that shows four options:
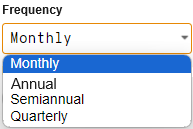
- Monthly:
For the monthly frequency, the report contemplates the chosen month by the user on the following field.
Quarterly:
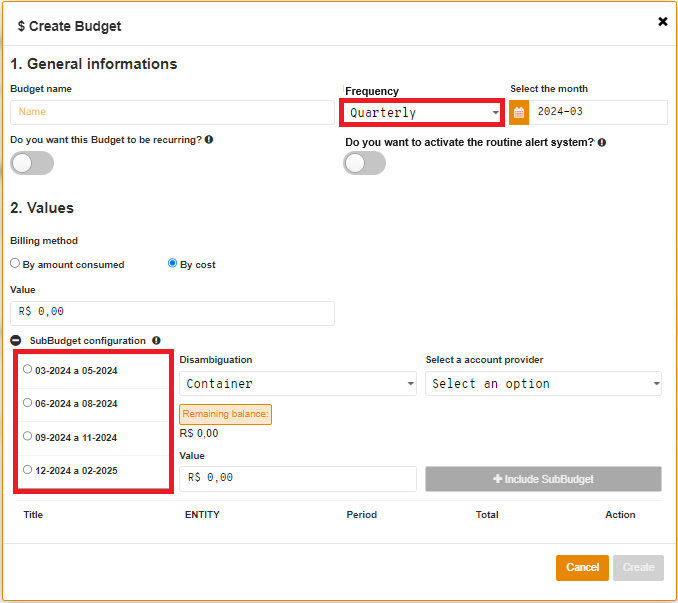
By selecting this option, the interface presents a list of periods, located on the area below the SubBudget Configuration area.
The application allows for the user to choose any quarter available within the period of one year.
Semiannual:
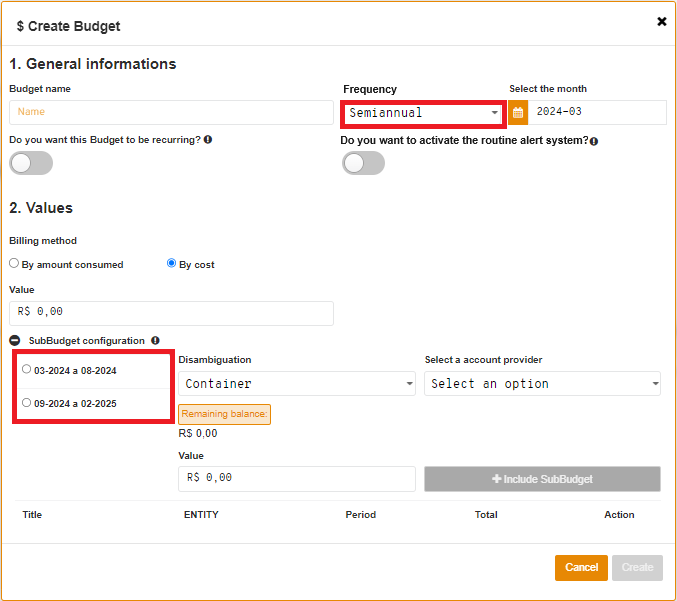
By selecting this frequency, two alternatives with the available semesters within the period of one year are presented.
Annual:
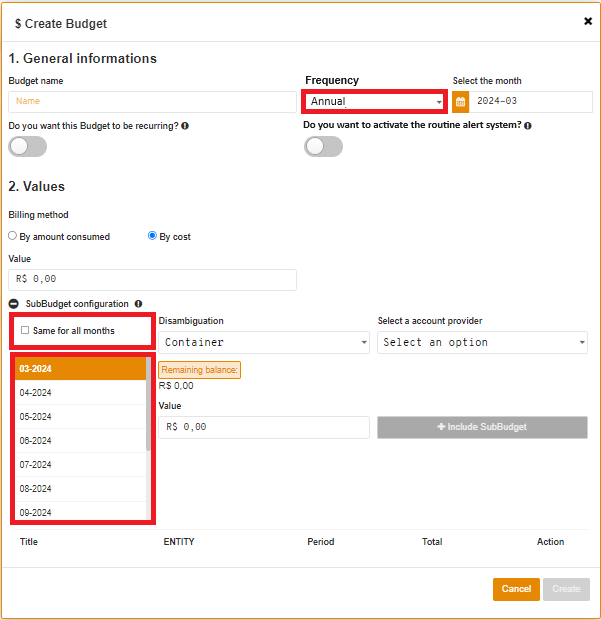
By choosing this type of frequency, a list of all with all the months corresponding to the period of one year is presented.
It is possible to create a sub budget for each month of the year, manually, or by checking the option “same for all the months”, evidenced in the image above.
Atenção
Creating sub budgets for all the months of the year, the sum must limited to the total value of the budget.
Select the month
After clicking on this field, a calendar is revealed.
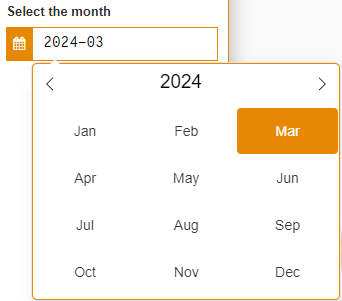
In the case of a frequency different from monthly, it is allowed the selection of multiple months with only two clicks. If needed, it is possible to return to previous months and years.
Recurring budget
By positioning the mouse above the tool tip, this message is presented:

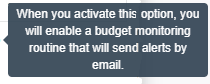
Routine alert
Hovering the mouse above the tool tip, the following information is shown:
To enable the functions mentioned above, just click on the flag. Which changes color when enabled.
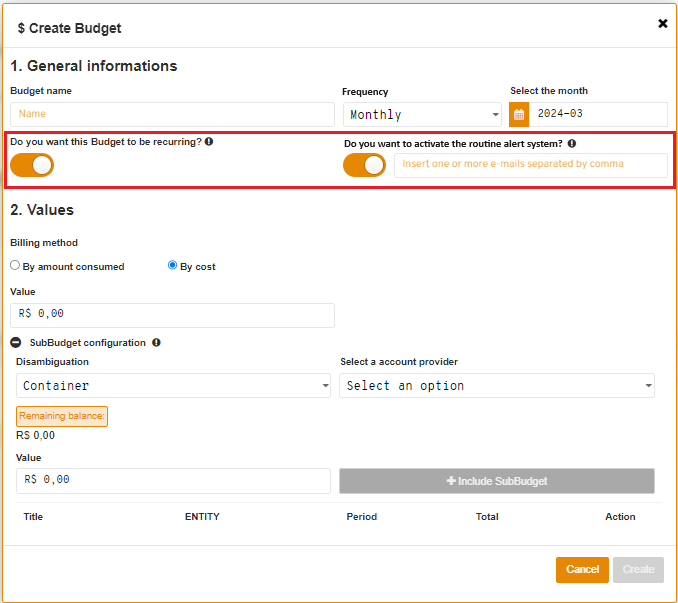
On the figure above it is possible to note that by enabling the routine alert flag, a field dedicated for the email is displayed next to it. In case it is necessary to alert more than one person regarding the budget level, separate the electronic mails with a comma.
The insertion of these are crucial for the user to receive the notification alerting about the budget.
2. Values
Form of charging
By consumed quantity
By cost
Value
3. SubBudget Configuration
The fields of this tab are hidden from the user, only showing when they click on the icon to show more  next to the submodal.
The details to be filled out in the sub budgets area are described below:
Disambiguation
Nota
The disambiguation is responsible for the sub budget purpose, when clicking on the dropdown menu, the user views and can filter one of the five types of existing elements: Account Master - Container - CloudType - Dimension - Tag.
Select an account provider
Atenção
This is a dropdown field, altered according to the option chosen in disambiguation:
In case the container is selected, the next field is designed to select an account provider;
In the condition of the Account Master choosing, the dropdown menu next to it is to choose one. Besides that, an extra blank to choose the Linked Account is shown.
If the CloudType option is selected, the user must pick the desired cloud;
When the Dimension is selected as the desired disambiguation, a listing of the available dimensions is presented;
By selecting Tag, fields of key and value are displayed. These, must belong to a valid tag, that it, already inserted previously.
Below this area, a card alerting about the remaining balance is shown.
Importante
The remaining balance corresponds to the value that indicates the balance left from the budget, equivalent to the value of the budget minus the sum of the value of all the sub budgets.
Value
Include SubBudget
The button mentioned above is only unlocked to be clicked after the filling of the modal’s blank.
Then, details of the sub budgets are presented and divided into five columns:
Title
Entity
Frequency
Total
Action
Atenção
This action corresponds to the deletion, represented by a trash can icon. By clicking on it, the just created sub budget is immediately deleted, being unnecessary the action confirmation by the user.
In the inferior part of the modal two buttons are displayed:
Cancel: it can be used in case the user gives up on doing the operation.Create: it must be clicked to save the budget.
Nota
It is possible to insert the sub budgets to the main Budget, limiting itself to the rule that its value has to be equal to the sum of the values of its sub budgets. In case the value represents a higher or lower number, the Create button stays disabled and the remaining balance is different from zero.
In the flow sequence, after finishing the information filling, it is necessary to click on the
Createbutton, located on the inferior right corner of the modal for the budget to be saved.
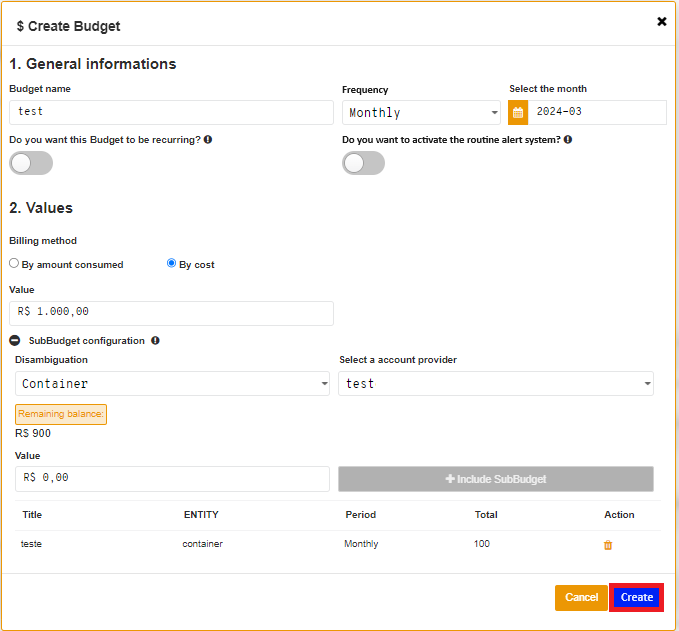
Then, a message is displayed in the superior right corner of the screen confirming the action.

This activity of budget creation can be followed in the Tasks menu.

Listing
In case the just-created budget does not show at the listing, just click on the update icon, positioned next to the button Create budget, as presented in the following image.
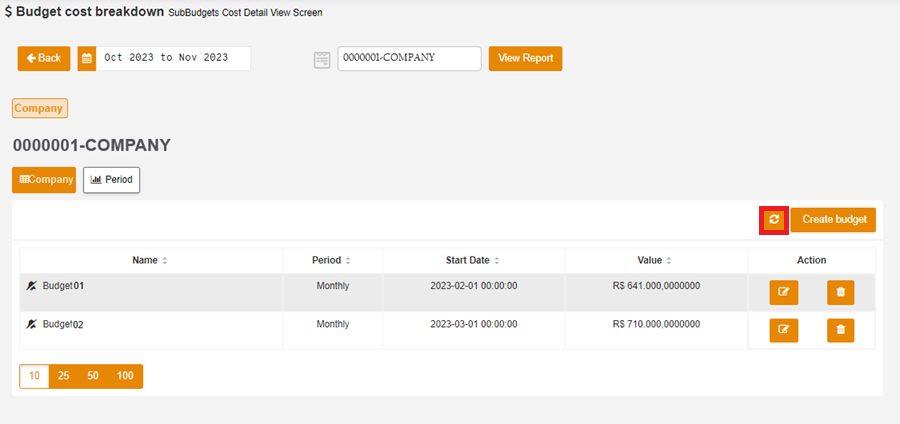
Regarding the budgets listing, this is separated into five categories:
Name
Frequency
Start date
Value
Action:
Edit
Delete
In the inferior part of the board it is possible to note the information blocks that allow to view of this list in 10, 25, 50 or 100 lines.
Editing
To edit a Budget, the user has to click on the edition icon in the column regarding the actions from the card, as evidenced on the image in the sequence.
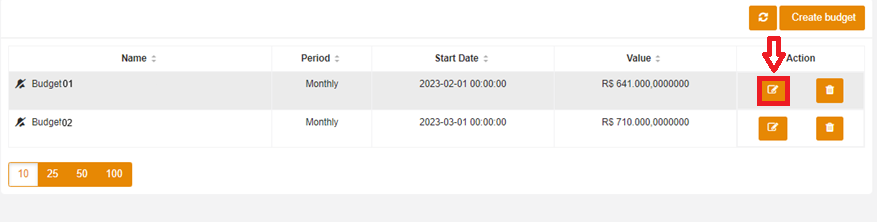
Then, the modal is presented with all the information previously filled.
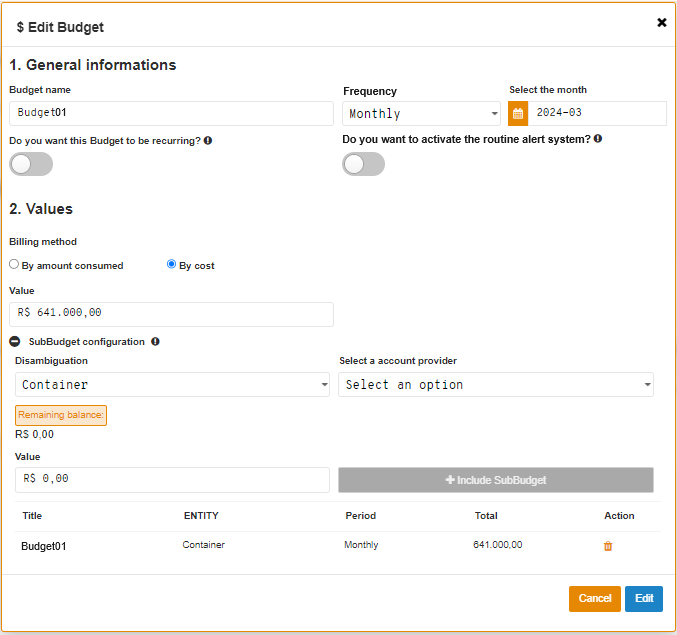
On this screen it is possible to edit anything that the user finds necessary, except the frequency.
The created sub budgets cannot be modified. It is necessary to remove them and create a new one.
Atenção
To remove a sub budget created previously, click on the trash can icon on the action column, below the sub budget details sub modal.
In case the user wants to cancel the operation, click on the Cancel button, or after finishing the editions, press on the Edit button, both actions found on the superior part of the modal.
Different from the creation flow, when trying to delete a created sub budget a message that needs the user confirmation is displayed on screen:
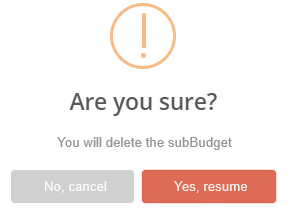
To give up on the operation, click on the button No, cancel and the user is redirected to the budget edition modal.
If affirmative to the sub budget deletion, press Yes, continue.
By confirming this action, a message is shown on the superior right corner of the screen.

Sequently, this operation can be followed on the Tasks menu, as evidenced in the next image:

Viewing the Budgets Costs Report
The viewing of this report can be accessed in the “Budget costs details” screen. It allows the user to be informed about the predictions and percentages of cost in detail.
The Budget cost detail allow the view clicking on the Period button, evidenced below:
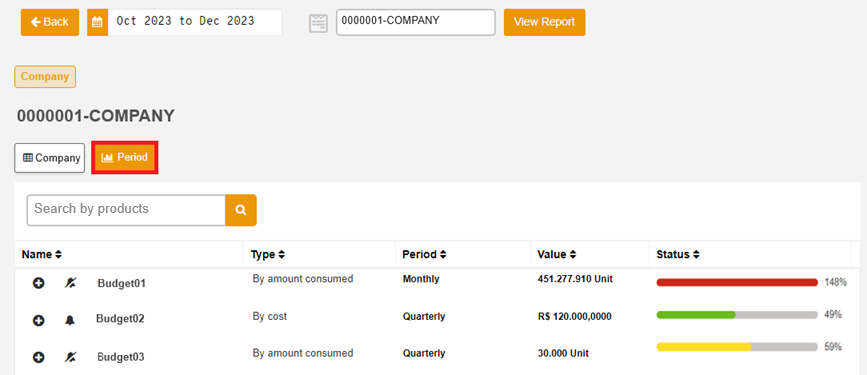
To make the search for a specific budget easier, below the type of listing choosing field, there is a search bar where the user can type the desired name.
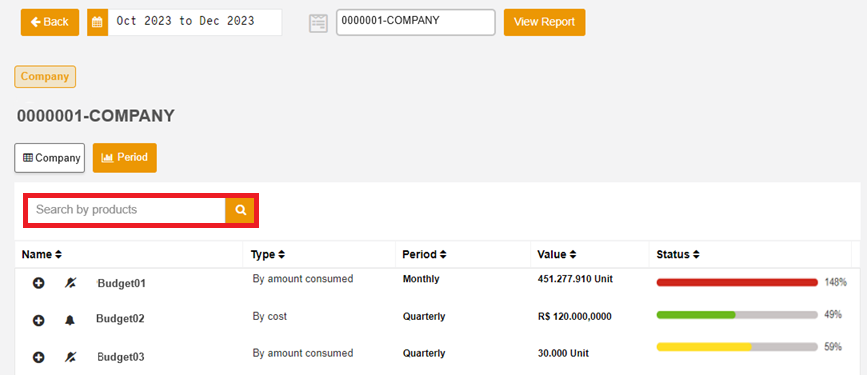
With the objective to make the budget cost details viewing easier, the listing is divided into five categories, they are:
Name;
Type;
Frequency;
Value;
Status.
Next to the name of each column is possible to notice a pair of arrows, when clicking on them it is possible to change the presentation form to ascending order.
Besides that, next to the names of each budget there are three icons:
Show more
: When clicking on this icon, the sub budgets are presented
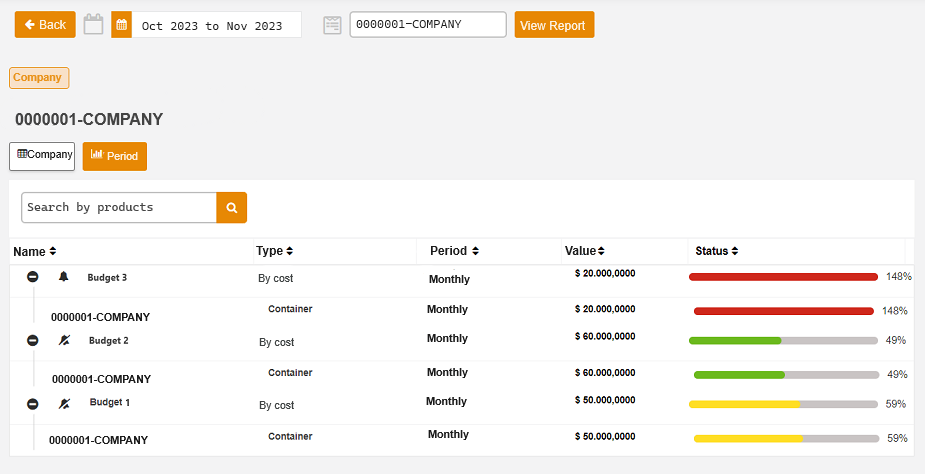
Alert on
 Indicates if the budget has the alert enabled.
Alert off
 Informs that the flag to alert about the budget consumption is disabled.
The interface delivers the necessary information for the user understanding about the sub budget costs, that are:
Company to which the budget and sub budget are linked to;
Type of disambiguation;
Frequency;
Total value of the budget stipulated on the creation moment;
Consumption bar;
Quantity which the sub budget consumed in percentage.
Importante
The consumption bar suffers color changes according to the consumed percentage.
Nota
By choosing a budget that has a quarterly, semiannual or annual, the platform displays only the sub budgets regarding the selected period. On this option, the platform understands that it is about the Budget’s incomplete period. To show all the months, the complete budget period must be chosen.
Routine Alert
This feature, also known as Budget Alert, can be enabled or not when clicking on the flag present on the budget and sub budget creation modal, as mentioned previously.
The notification is sent for the registered email(s) as an automatic message, with no need for a reply. This is due to the fact that the sender is “no reply”, as it is possible to be seen in the image below:
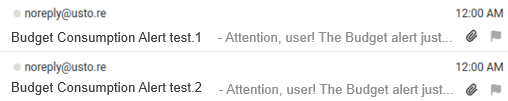
When clicking on the email, the following message is shown:
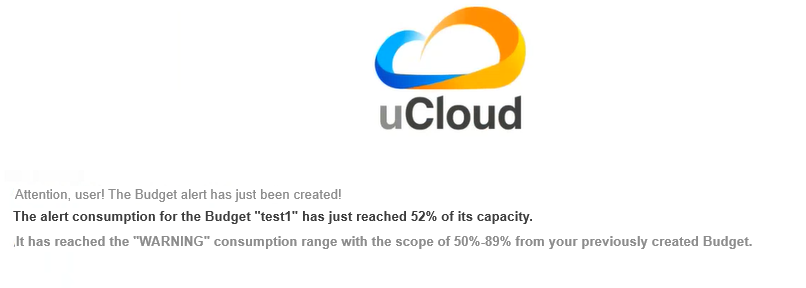
It is worth highlighting that just one email is sent for every level the budget reaches. The levels are:
Normal:
Corresponds to 0%-49% of the total consumption allocated for the budget.
Represented by the green color in the budget costs report.
Warning:
Corresponds to 50%-89% of the total consumption allocated for the budget.
Represented by the yellow color in the budget costs report.
Danger:
Corresponds to 90%-99% of the total consumption allocated for the budget.
Represented by the red color in the budget costs report.
Over:
Corresponds to the above 100% of the total consumption allocated for the budget.
Represented by the red color in the budget costs report.
Consumption Monitoring Report (CRM)
The Consumption Monitoring Report (v1) is a new functionality of the uCloud portal, which deals with the invoicing tracking and complete spending detail, categorized by Clouds (for example: AWS and AZURE) Contracts and Resources.
In this document, different types of indexes are generated, which can be tables, reports and graphs, for each type of class (Resource, Contract and Cloud). These are titled in topics as:
Invoicing History;
Invoice per Contract/Project;
Major Variations on this Invoice and
Detailing TOP 3 Contract per Cloud.
Atenção
Each of those categories is separated and organized from the highest to the lowest consumption.
In addition, the Consumption Monitoring Report (v1), briefly named CMR.v1, compares the expenses of the current month with the previous month, providing the company with the necessary information to be able to evaluate the disbursement and have an efficient control of possible drops or increase in consumption.
Accessing CMR.v1
To generate the Consumption Monitoring Report (v1) on the uCloud portal, the user must access the Billing menu, identified in the lower left corner. And then, click on the Reports submenu.
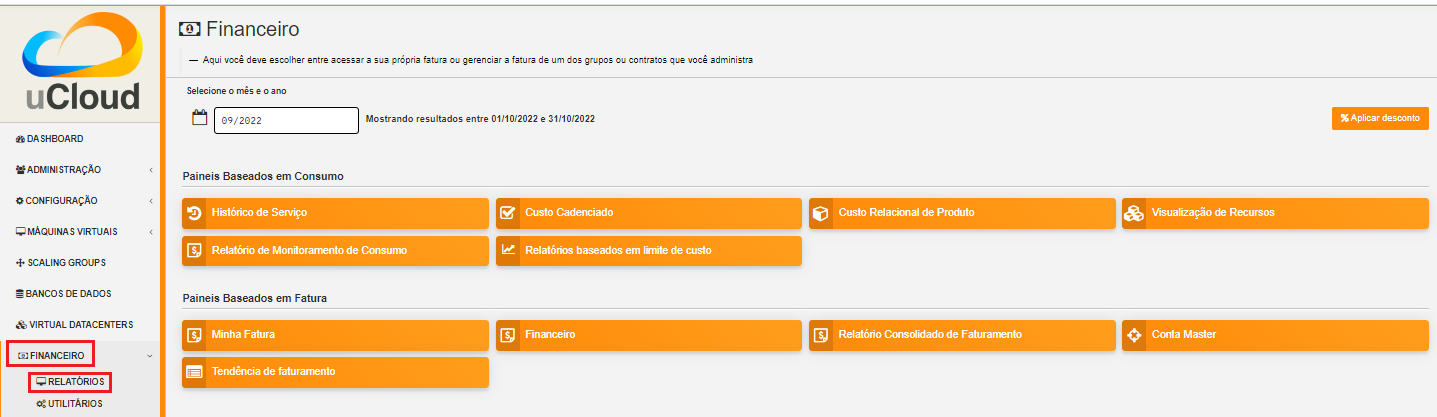
The screen below presents all the options related to accessing and managing invoices for groups or contracts that the user administers.
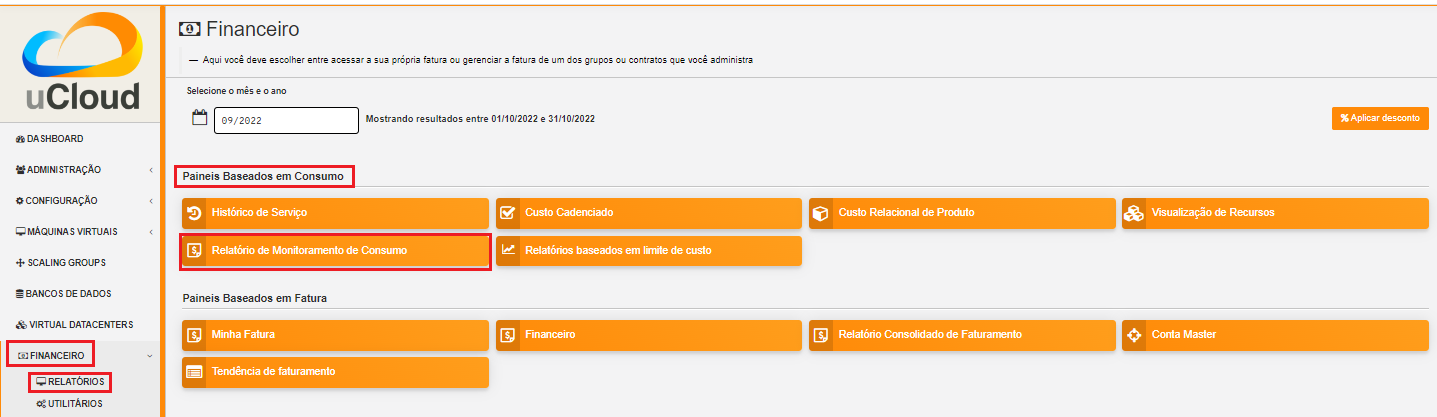
When clicking on the Reports submenu, the topic “Consumption-Based Panel” provides access to reports related to consumption for the current month typed on the search by the user.
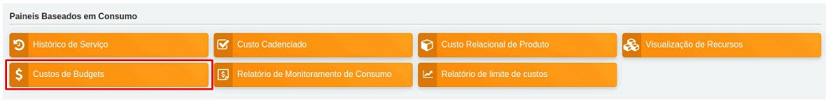
It groups seven types of reports, one of them is the Consumption Monitoring Report - CMR.v1.
By clicking on this option, the user can generate the desired document.
Creating CMR.v1
After clicking on Consumption Monitoring Reports (v1) - CMR.v1, a new screen opens, in which the user can select the month and year they desire to visualize, in addition to filtering the intended contracts.
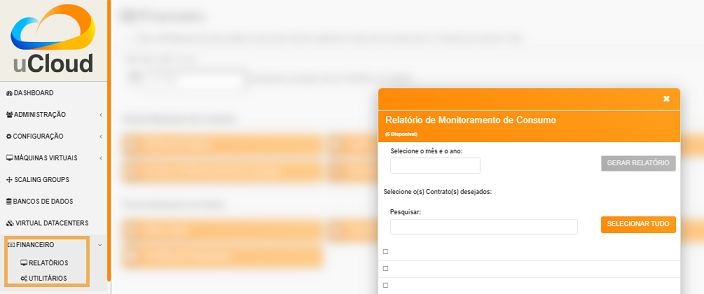
In this same modal, two buttons are displayed:
GENERATE REPORTRemains available for activation when at least one contract is selected.SELECT ALLRefers to the contracts filter. There it is possible to note the scroll and search bar.
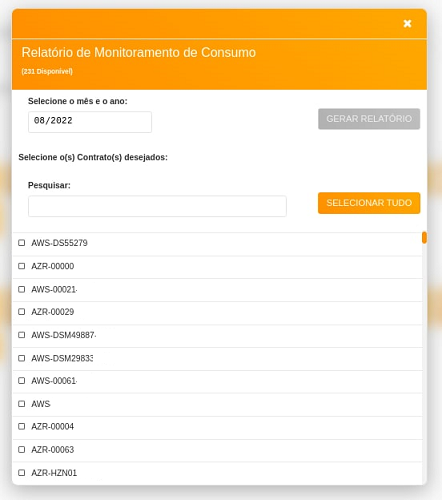
The scroll bar, located on the right side, helps the user to navigate through the modal in search for the desired contract. The search bar facilitates the search, the user just needs to type the initial letters of the contract.
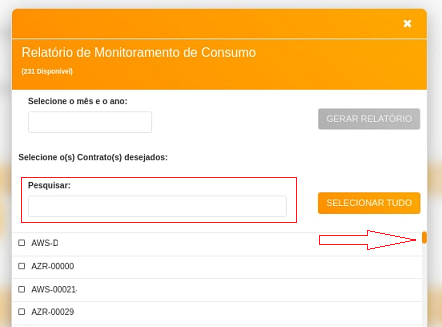
After clicking on Generate Report, a new screen opens, showing the month selected by the user and the DOWNLOAD and GENERATE NEW REPORT buttons.
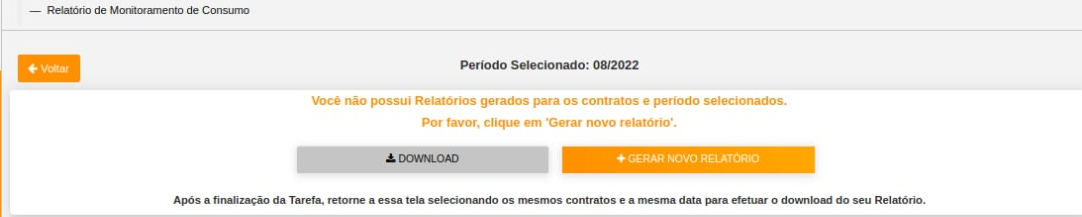
The DOWNLOAD button is only unlocked when the data is compiled on the platform and it makes available the report for the period and the selected contract.
In the example of the following screen, the platform informs that the “user does not have reports generated for the contracts and period selected” and asks the user to click on GENERATE NEW REPORT.
To download the file, the user just needs to click on the referred button.
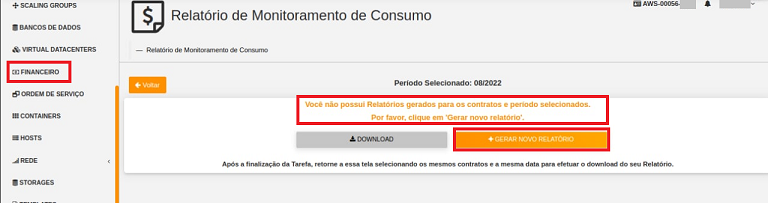
In case there is no data, the reports become unavailable for the selected month, the DOWNLOAD button appears inactive (gray color) and the platform issues the message mentioned in the previous example and printed on the image above.
When there is data to be published on the period selected by the user, the platform informs that the report is in process of compiling the data.
Following the status on the Tasks menu
In the flow of creating the CMR.v1, the platform presents two types of situations, according to the user profile that is logged into the platform. The task status at the top of the screen differs, for each type of user, a procedure is described in the sequence:
Case 1:
Admin user: When opening the Tasks functionalities, it must be observed the “Pending Approvals” tab, which presents the columns: Operation, user, details, progress, start date, duration, status and actions.
Case 2:
User user: When creating the report, the user must request the administrator of their contract to carry out the approval of the requested task.
Procedure:
In the “Actions” column located on the “Pending Approvals” tab the admin user of the contract must approve the action to “Generate Report”. In case of the “User user”, they must request the administrator of the contract to carry out or not the approval of the task.
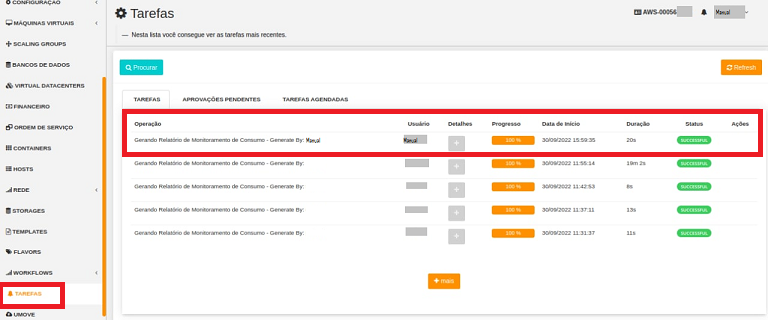
Next, they must wait for the “Status” to be updated, that can be: Running, Failed or Success.
After successfully creating the new report, the data was compiled on the uCloud platform.
Enabling the CMR.v1’s download
When creating a new report successfully, the user must repeat the flow to download it once the data is compiled on the uCloud platform.
In the sequence, it is necessary to select again, the same period and contracts that the user intends to search for previously created information.
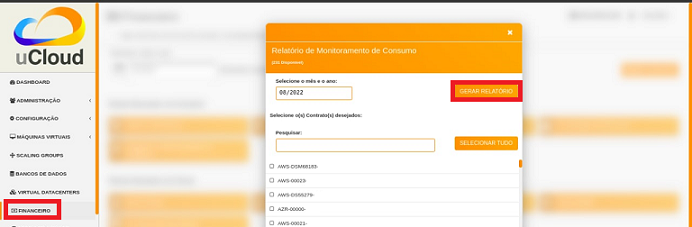
At this point, the user must observe if the GENERATE REPORT button is enabled (orange color), if so, it means that the flow to download the CMR.v1 continues, the data is previously prepared and can be extracted in the report format.
In the course of this procedure, the platform presents the unlocking of the DOWNLOAD button, displaying it in green, according to the following image.
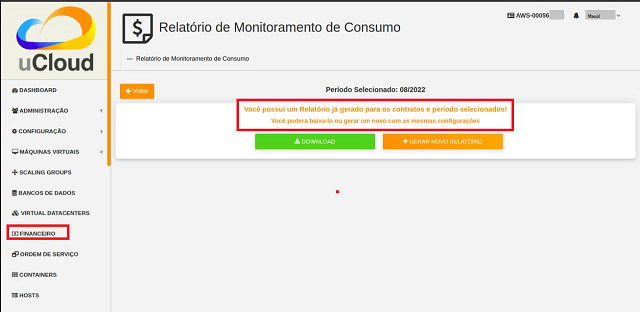
The user must check the message the platform presents: “Report generated for the contracts and selected period. They can download it or generate a new one with the same settings”.
At the end of this sequence of activities, to download the desired CMR.v1 file, the user must click on the DOWNLOAD button.
Viewing CMR.v1
After generating and downloading the Consumption Monitoring Reports (v1) - CMR.v1, an example is presented and described:
Front Cover
The document has a cover, which contains the following information:
Name of the company;
Invoicing Date;
Standardized text on the invoicing of consumptions in the clouds.
According to the picture shown below:
1 - Executive Summary
In the Executive Summary, an explicative text is presented, describing the variation of the values and the percentage that occurred in the current month’s invoice in comparison to the previous month, as shown in the example:
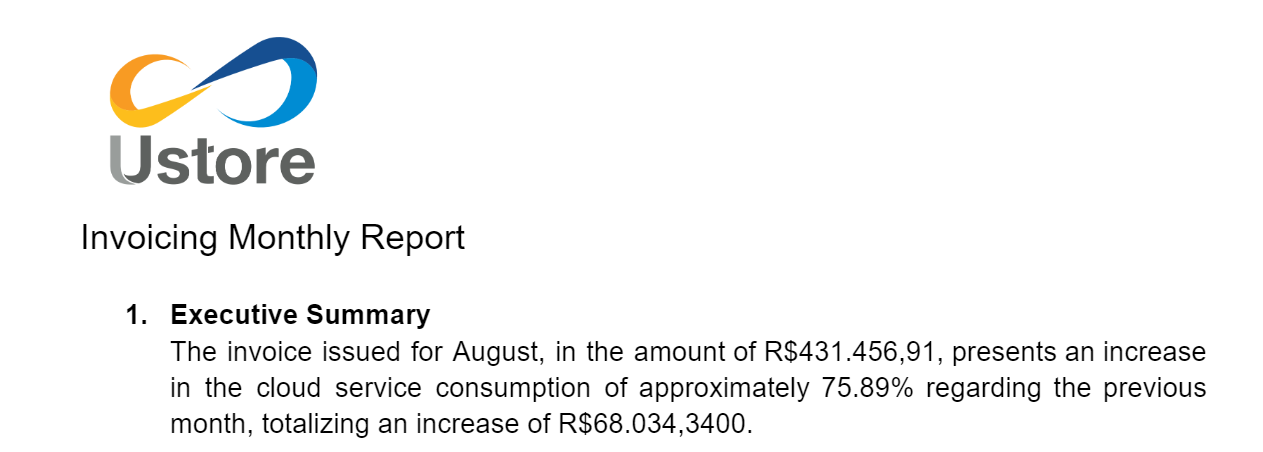
1.1 - Invoicing History
Right after the executive summary, there is the Invoicing History, that presents a table with the period selected by the user, in which the value of the desired cloud in Reais (BRL) and Cloud Service Unit (Unidade de Serviço de Nuvem - USN -, in Portuguese) is shown , and the rate of change in percentage of the previous month as well as the current month.
Atenção
Cloud Service Unit (USN), is a pricing model for cloud services, assigned to companies that are associated with the government spheres.
Importante
 USN aims to establish itself as a predictable, linear and flexible method to obtain a specific amount to be charged for cloud computational services.
Nota
The USN metric consists of establishing a specific reference value for each type of cloud service, according to the individual metric associated with the resource consumption.
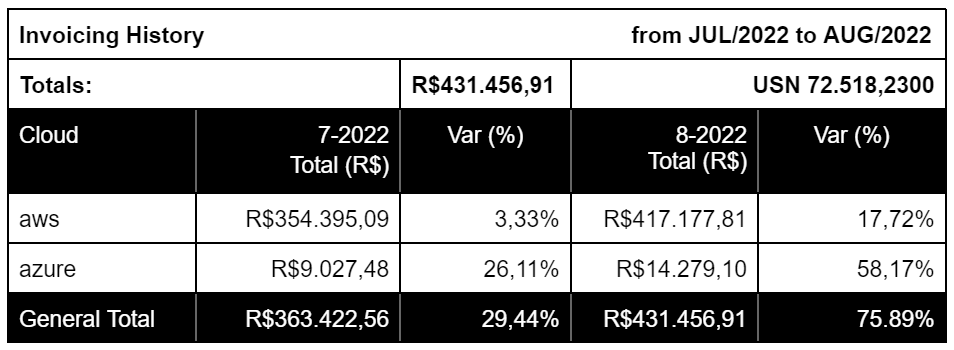
According to the example above, the expenses of the current month are compared with the expenses of the previous month, showing if there was an increase or decrease in consumption for each specific contract, it also exhibits the percentage and possible variations from the previous month to the current month.
In addition, this part of the implementation exposes a basic rule: only the 5 biggest expenses are specified, that is, the contracts that had the highest consumption during the current month are disclosed, together with the values of each one separately.
This rule is intended to keep the document more compact, avoiding to extend it, according to the examples below:
First AWS cloud example:
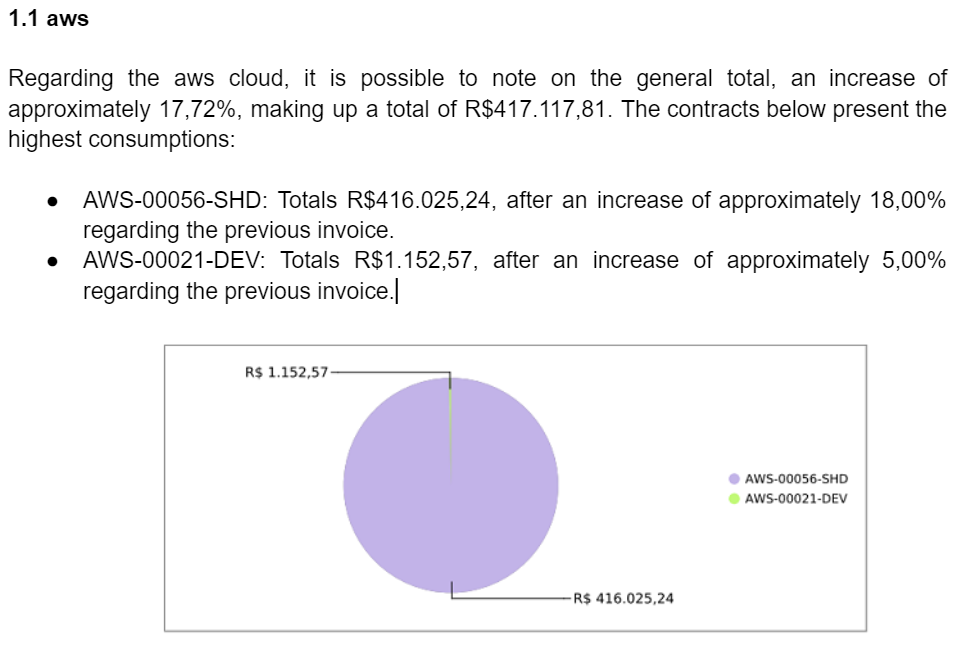
For the sake of completeness and better visualization, this part of the document also generates a pie chart, containing the same information as the expenses of the table illustratively, separating the contracts by colors for better comprehension by the user.
Second example of AWS cloud pie chart:
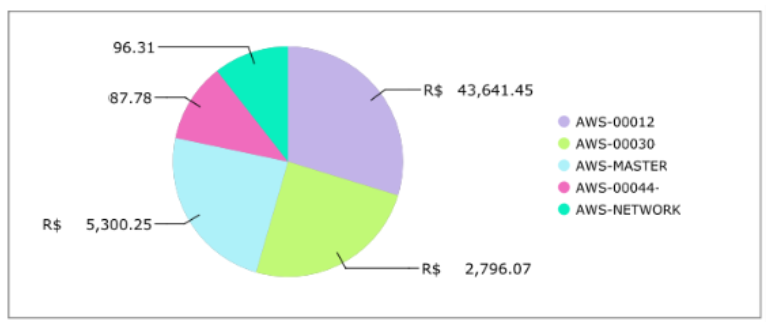
Nota
In case of more than one cloud, the report follows the same pattern of presentation and information.
Third Azure cloud example:
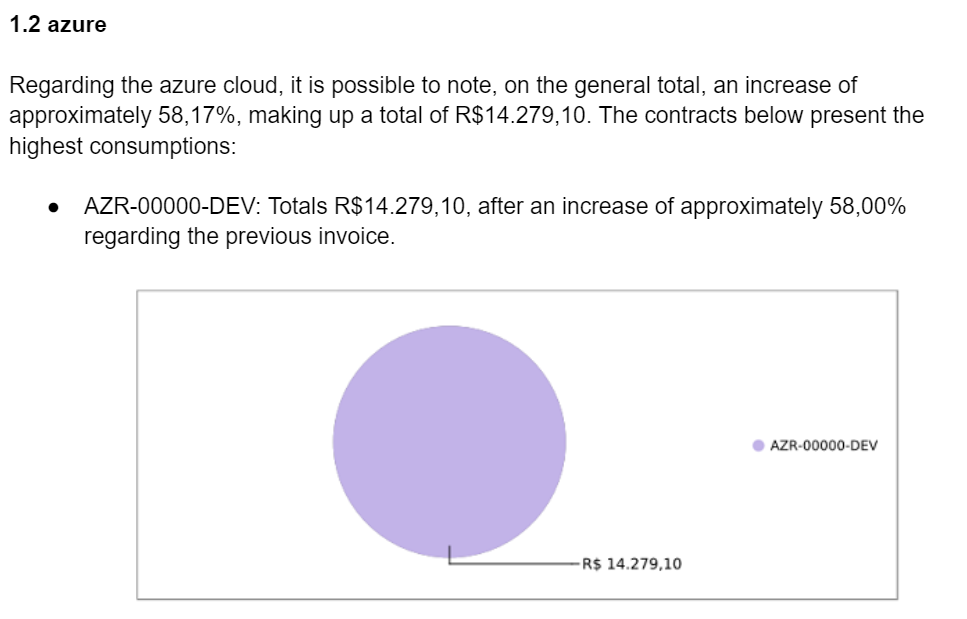
2 - Invoice per Contract/Project
In the Invoice per Contract/Project, the general expenses of the contracts of each cloud is first informed, as shown in the executive summary, with their values in BRL and USN.
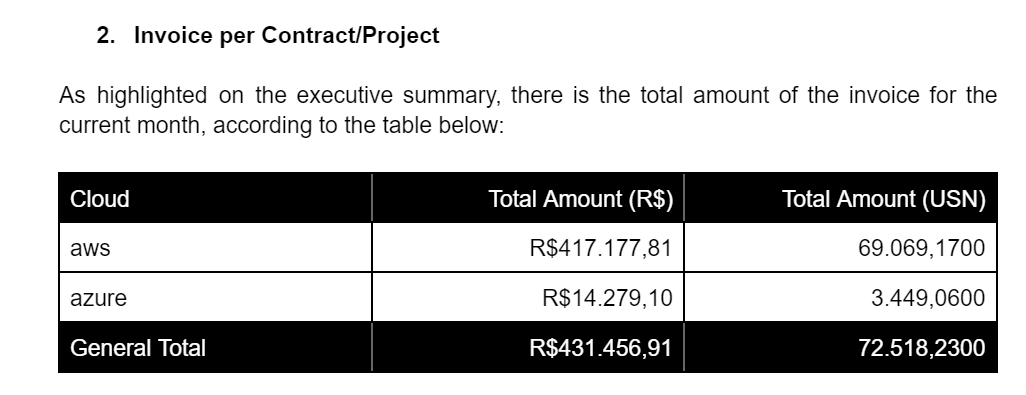
Following the table, a graph is presented containing the proportion of these consumptions in percentages, as shown below:
As in the Invoicing History, in the Invoicing per Contract/Project, a graph is also generated for complementation and better visualization of the user, containing the same information of the expanses of the table illustratively, demonstrating the proportion of expenses per cloud.
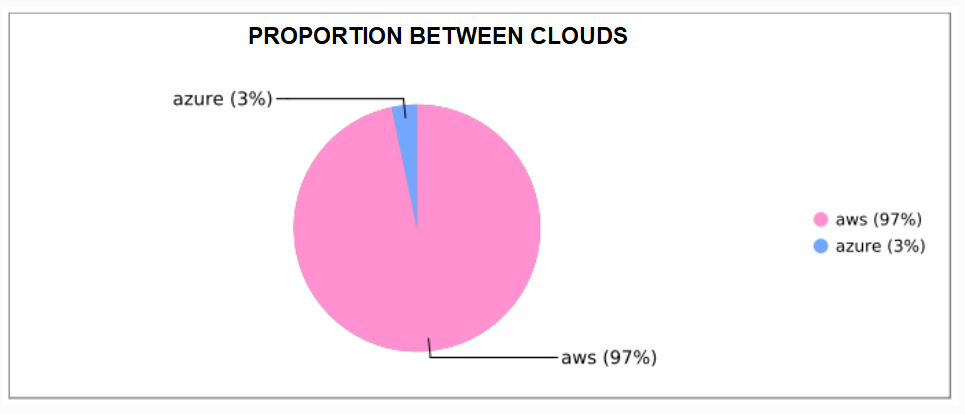
After the chart, the following image exposes and specifies all contracts for each cloud (in addition to the top five displayed in the invoicing history), with the most recent projects being highlighted.
The example in the table below details the costs of the cloud, its contracts, and totals the value, presented in BRL and USN.
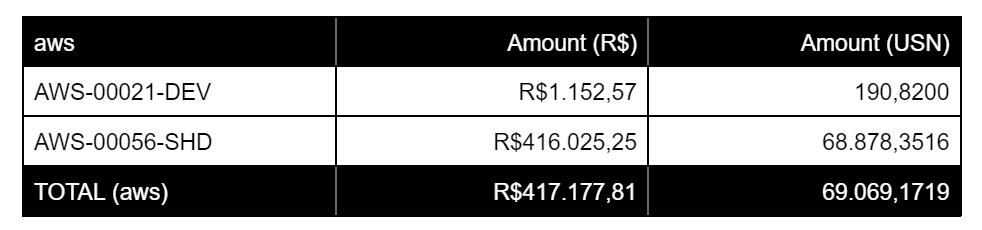
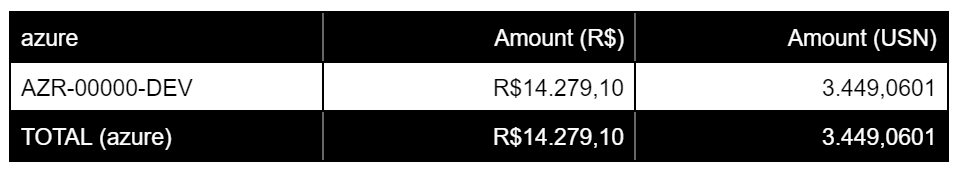
Nota
Note that in case of more than one cloud, the report follows the same pattern of presentation and information.
3 - Major Variations in this Invoice
In the “Major Variations on this Invoice» are presented in a table, all the variations of the contracts of the month of each specific provider, comparing the value of the previous month with the value of the current month, showing the variation of its total value in percentage, thus, this part of the document is a complementation to the “Invoice per Contract/Project”.
This table takes into account only the most relevant variations, with a cut containing, first, those greater than or equal to fifteen percent (>=15%), and therefore, those less than or equal to negative fifteen percent (<= -15%). Here’s, the example:
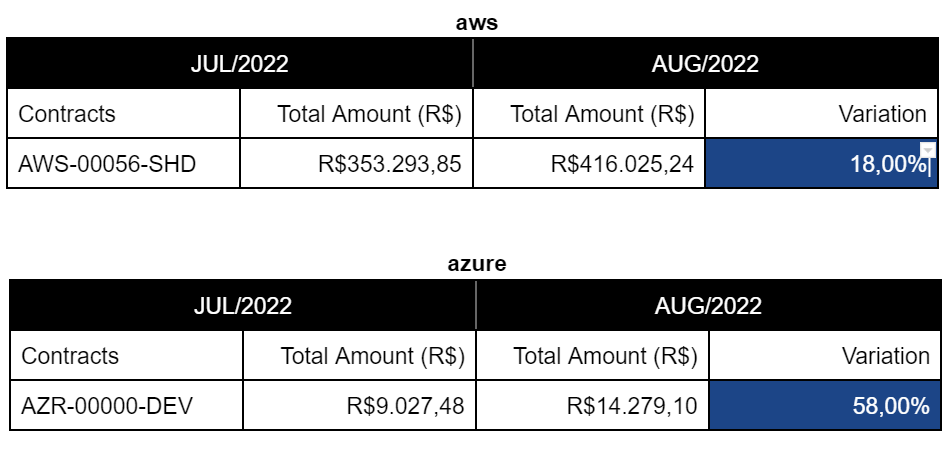
Positive variations (>=15%) are highlighted in a bluish tone, in the same way that the negative variations (<= -15%) are highlighted in a reddish tone.
It is possible to notice that the greater the variation, the darker the tone.
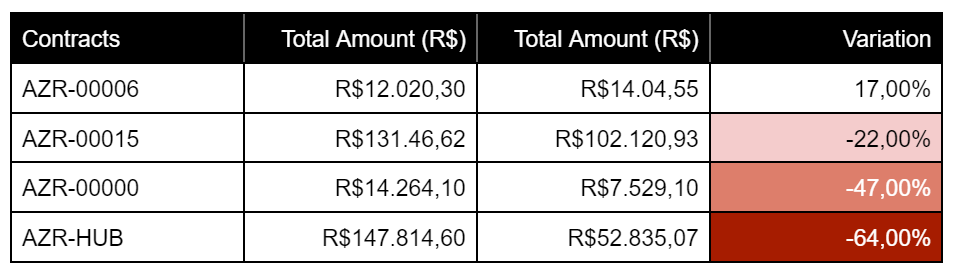
Furthermore, the contract with the highest variation value is highlighted, and presents the information of its resources detailedly. This chart are contains all the contract resources and their expenses, informing the changes in their consumption and its use. The graph also shows which were the resources that spent the most in the month, as exemplified in the following image:
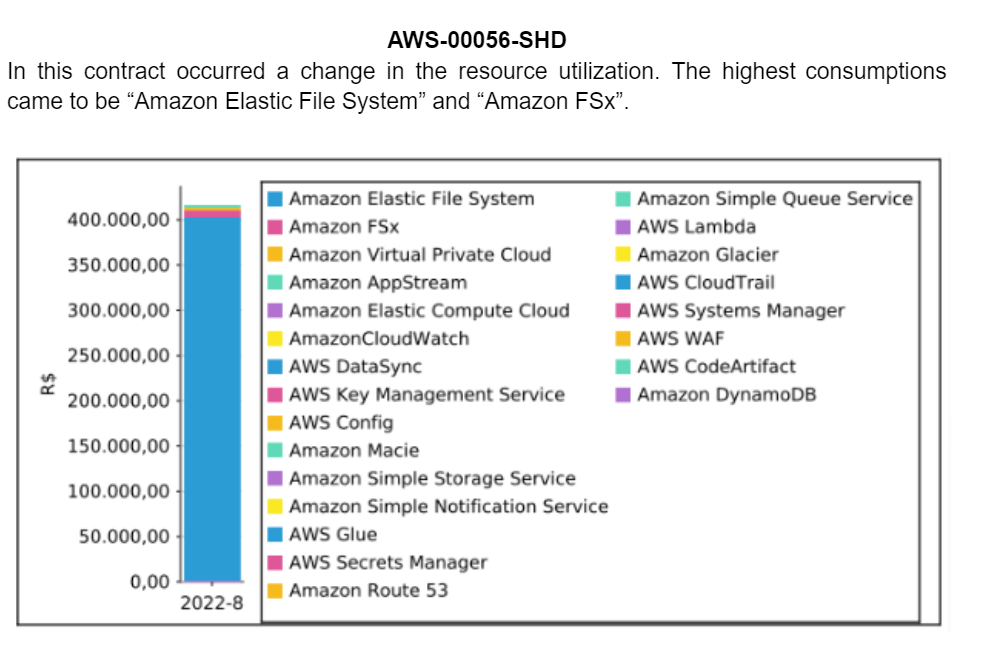
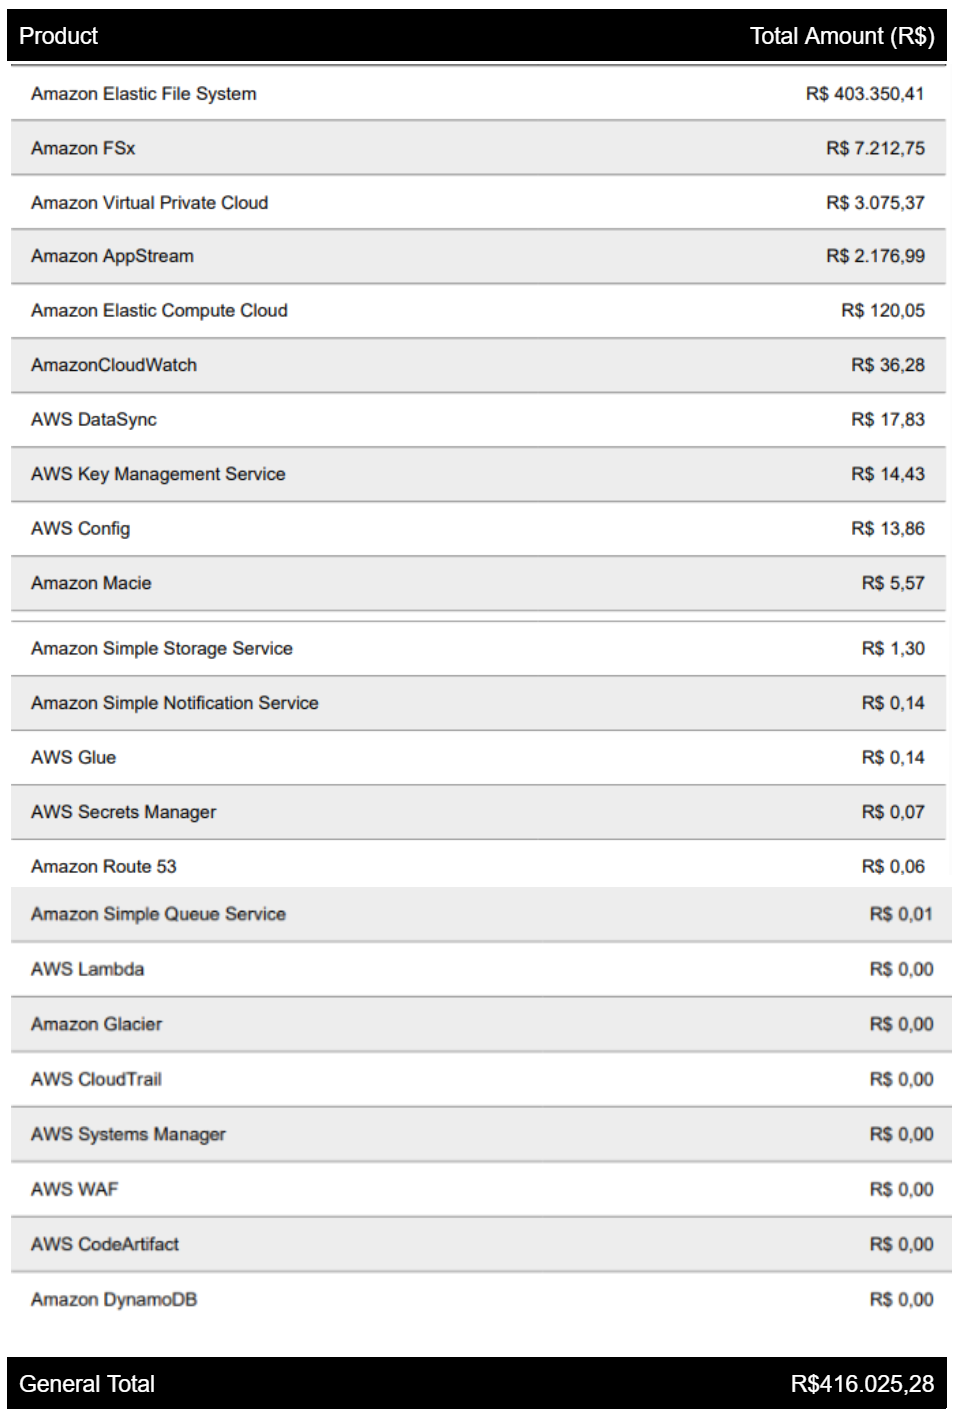
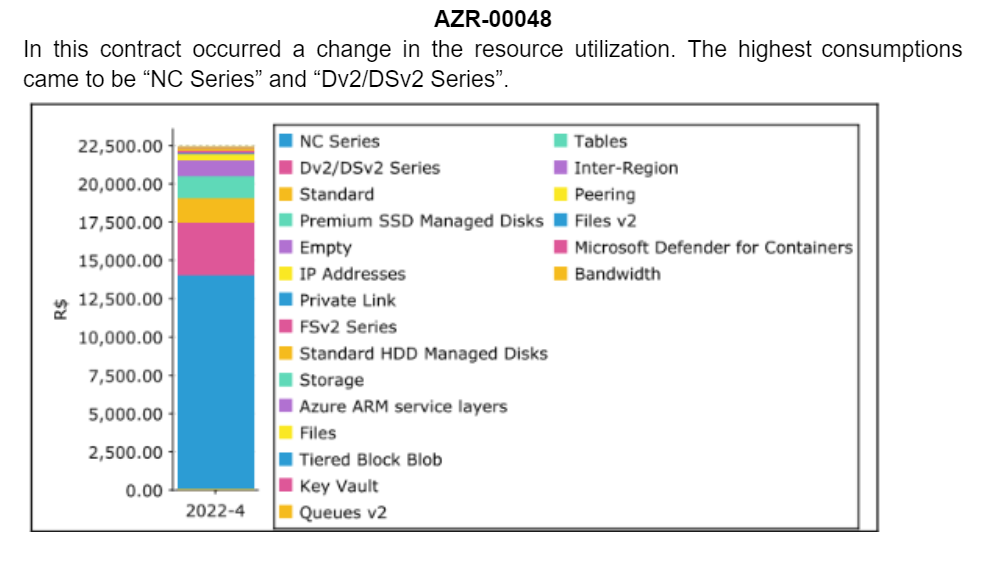
Right after the bar graph, a descriptive table is presented, with columns «Product» and «Total Amount» (BRL) of the quantities of each resource invested separately and specifically, from the highest number to the lowest.
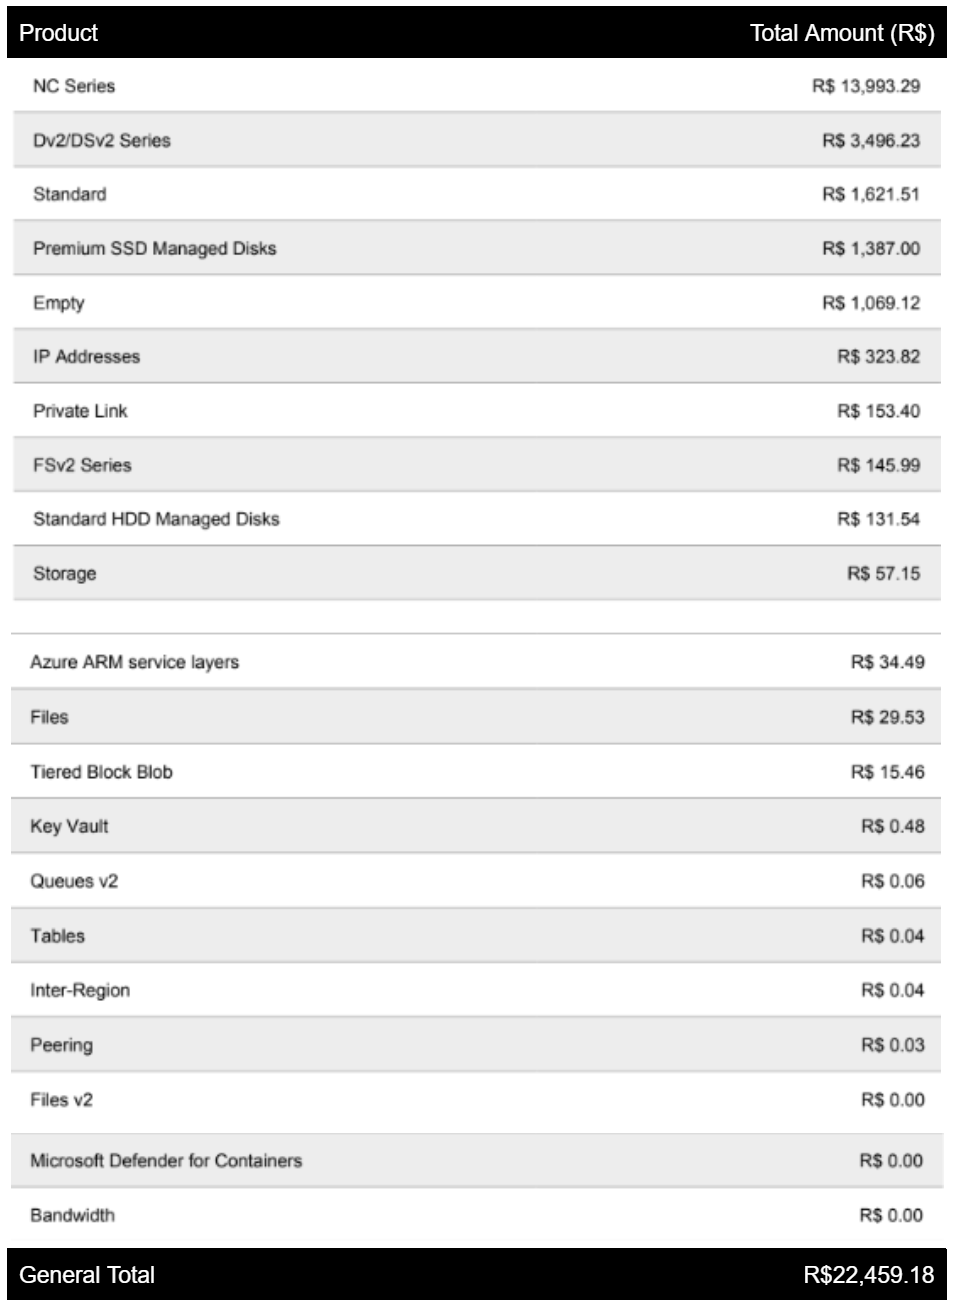
Nota
In case of more than one cloud, the report follows the same pattern of presentation and information.
4 - Detailing TOP 3 Contract per Cloud
Finally, an index is exposed, containing the clipping of the three contracts that had the highest consumption in each cloud, and the resources that represent the greatest impact in each one of them. The report presets each of the clouds used by the company, the name of the contracts and their total values in BRL and USN, as presented on the next example:
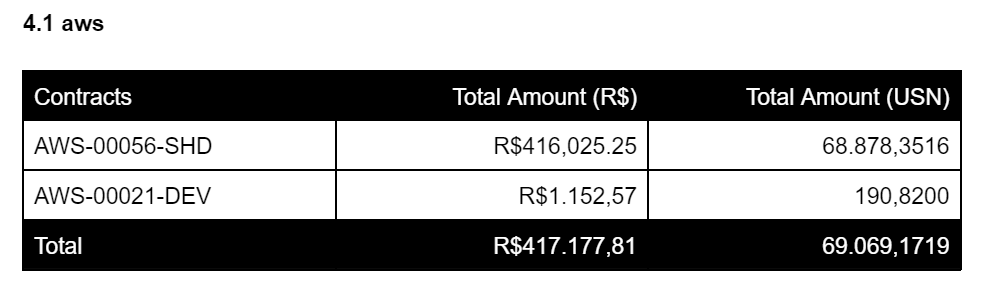
Next, the summary of how much each product costs the contract is presented in more detail, specifying them and showing the percentage of the total expenses of each contract. Such information is displayed from a illustrative graph, according to the example below:
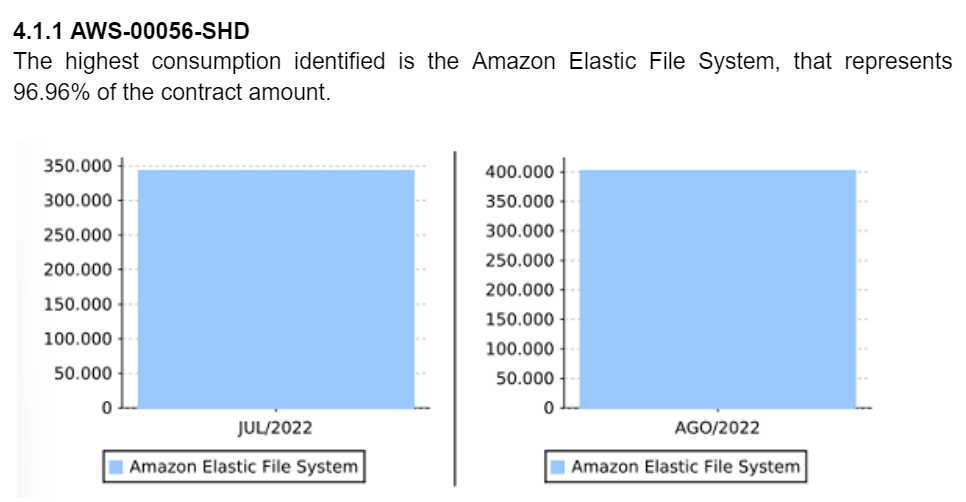
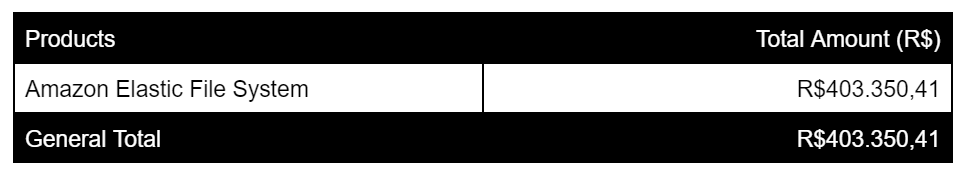
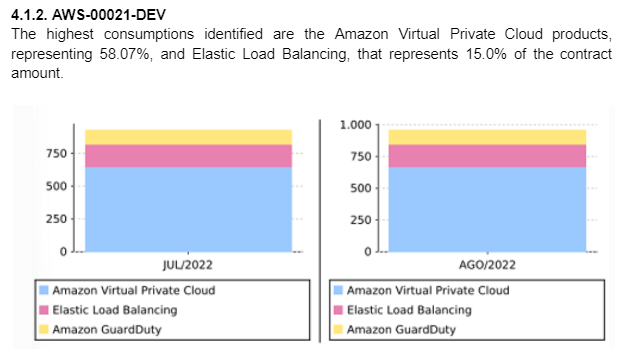
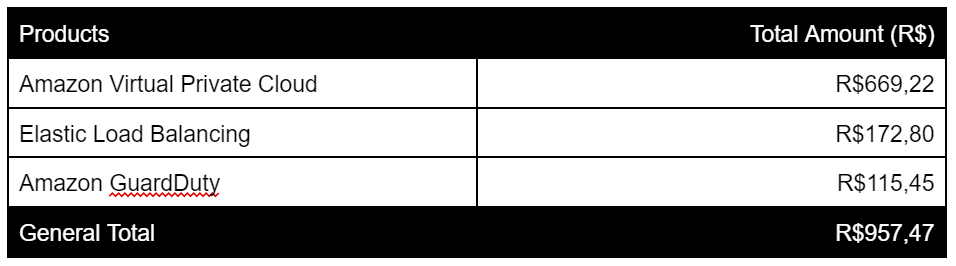
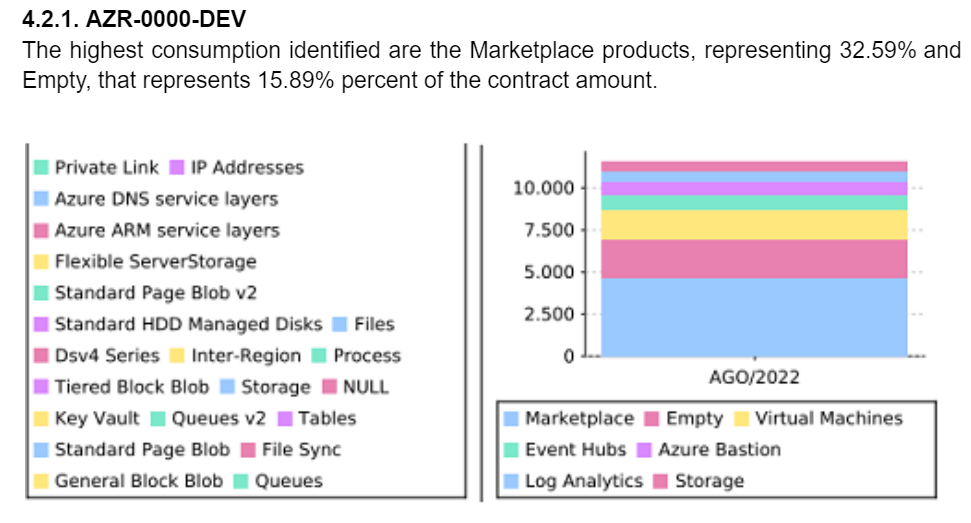
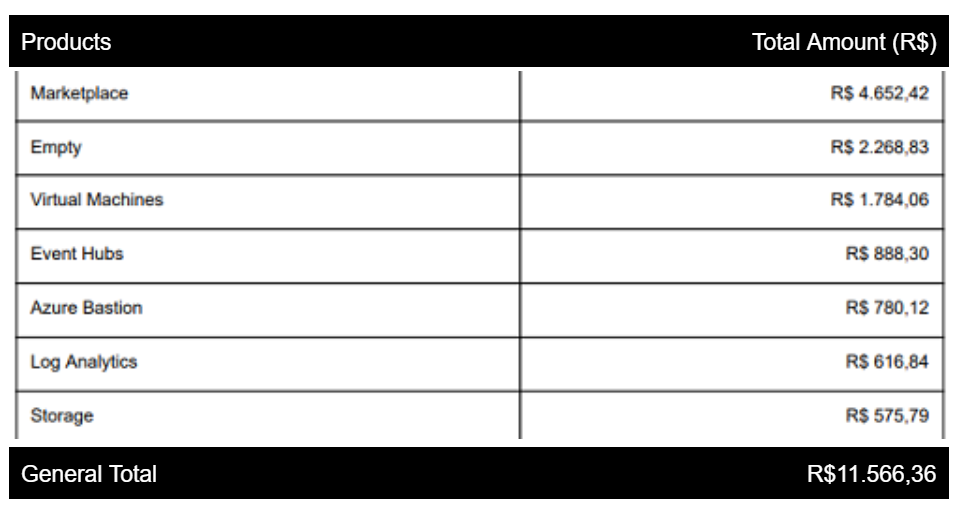
Atenção
In case of more than one cloud, the report follows the same pattern of presentation and information.
Finally, is noticeable that the implementation Consumption Monitoring Report (v1) CMR.v1, helps to control the monthly expenses, presenting and comparing them with the previous month.
This update has a vast index, containing tables, reports and graphs that range from the most general to the most specific, granting the company and, consequently, the user all the necessary information and tools that allow total control over their investments and projects.
Cost limit-based Reports
Aviso
On some service cloud providers, the term used is “cost limit” in others is “cost threshold”. When mentioned in this manual, both mean the same feature.
The cost limit reports are based on consumption, implemented with the objective to define a cost limit as reference point, so the user can monitor the expenses and, through projections, predict when the monthly total consumption exceeds this reference amount.
To have access to these new uCloud platform implementations, it is necessary for the application user click on the “Billing” menu and, then, on the “Reports” submenu. On the sequence, two categories of panels are displayed: Consumption and Invoice.
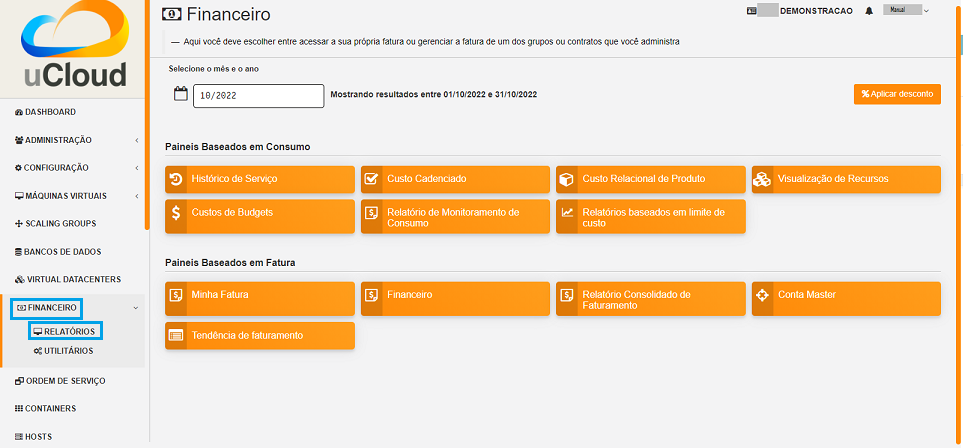
The access makes it possible to verify the reports regarding the current month, after the user types the desired period on the search blank. This view allows the user to keep themselves informed about the cost predictions, in detail.
The first topic “Consumption-based panels” groups seven types of reports, they are:
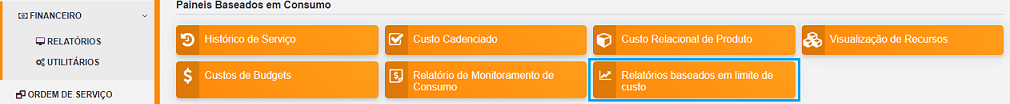
Service History;
Cadenced Cost;
Product Relational Cost;
Resources Viewing;
Budgets Costs;
Consumption Monitoring Report;
Cost-limit based reports.
Atenção
The number of reports displayed on the Billing menu, Reports submenu, “Panels based in Consumption and Invoice” topics may vary its amount of buttons, according to the client’s contract, it can be the maximum of seven and the minimum of one.
This registry regards the access to the option of the button: Reports based in cost limit, by clicking on it two new reports for this modality are shown:
Costs limit report and
Risk analysis.
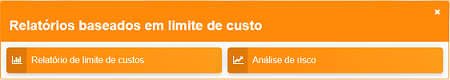
Defining the Reports
Next each cost lizmit-based report is described, along with a brief explanation of how to use it:
A. Cost Limit Reports
The cost limit report allows the user to observe month to month the consumption made, making it possible to execute the monitoring of which months exceed the cost limit defined by themselves, and represented on screen through a dashed line.
On the image below it is possible to observe how this report is shown in a bar graph:
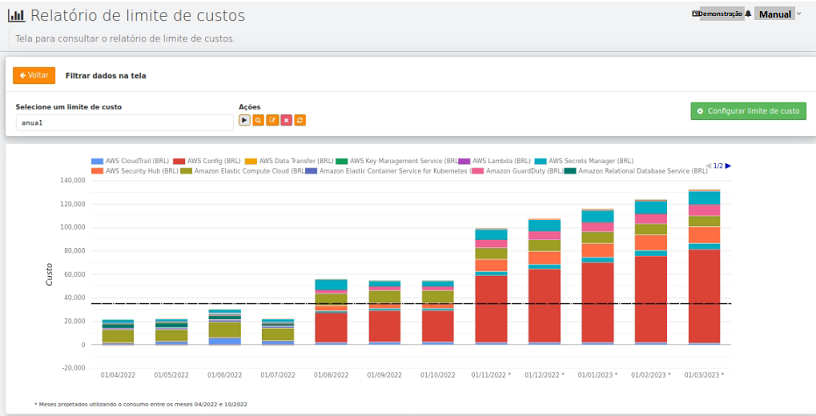
New features:
The “Costs limit report” screen differs from the other reports, because on it it is possible to do all the operations, they are: create, edit, delete and execute. Therefore, it becomes simple for the user to do its actions.
Step by step:
At this moment it is informed step by step to carry out these actions on the cost limit screen.
1. Executing without saving
To run the report, without having a previously saved cost limit, it is necessary to click on the green-colored button, named Configure cost limit located on the inferior right side of the card, as evidenced on the image below:
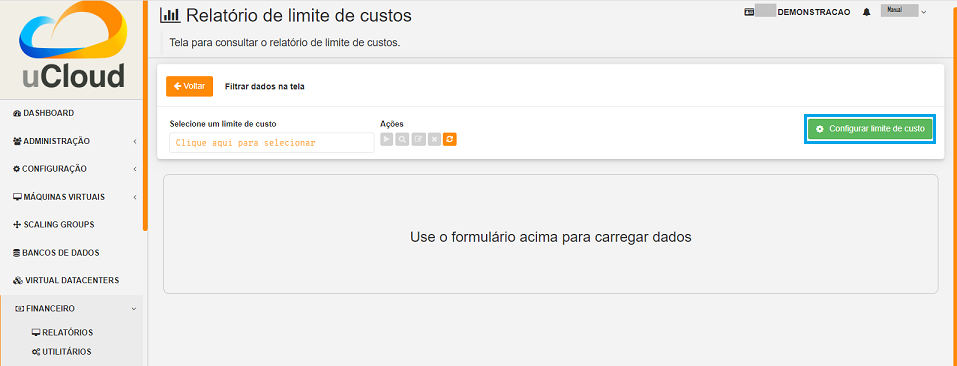
On this flow, the “Dynamic cost limit” modal is open, where the user can configure what desires to generate the Cost Limit Report. In the following image it is possible to note the blanks to be completed.
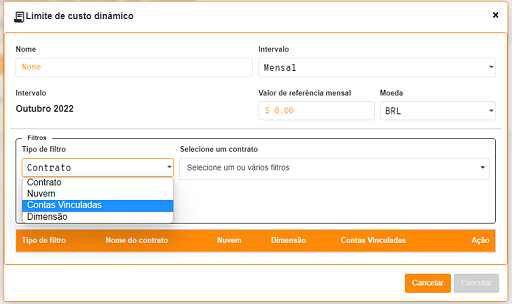
Below is detailed each space of the modal above for the filling:
Steps for Configuration:
The user must inform a name for the cost limit;
2. Insert the period, it can be: monthly, quarterly, semiannual or annual; 2. Inform the reference value; 3. Chose the desired currency, it must be BRL (Real), USD (Dolar), MXN (Mexican Peso), EUR (Euro) and COP (Colombian Peso); 4. Add the needed filters: Company, Cloud, Linked Accounts and/or Dimension.
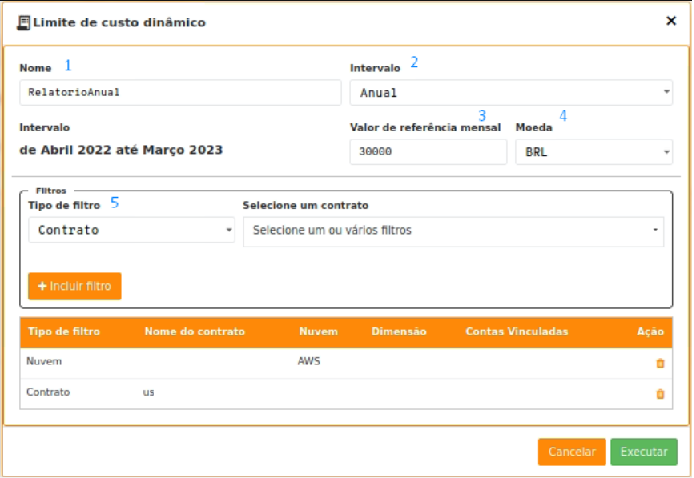
Importante
The company, cloud and linked accounts filters can work together, however, Dimension must be used only with other Dimension filters.
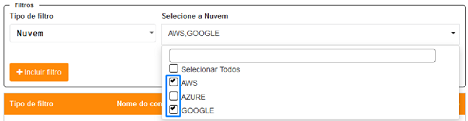
The user can also add several filters at the same time through the checkbox, located on the dropdown menu.
Periods Details:
Each period automatically configures its start and end month. The table below describes the start and end month of each type:
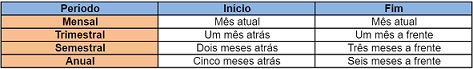
Post-configuration procedures:
After the configuration is done, the user must press the Execute green-colored button, located on the inferior right corner of the modal. Therefore, the process for the data loading is started on screen.
With the loading complete, the user has on the center of the screen a graph with a cost limit line and the total cost of the month separated by product name (when using the Company and/or Cloud) or by Dimension name (when using the Dimension filter).

Right below, three other information are shown:
Total cost per month and currency;
Cost by product name, separated by month;
Summary of the configurations applied to generate the report.
The user can observe the following image, to refine the viewing of the chart above:
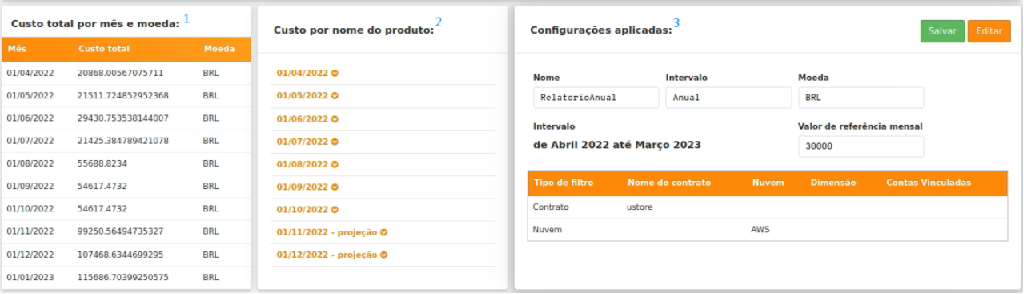
In the figure above, the third card “Applied Configurations”, makes it possible for the user to click on Edit, the orange-colored button, located on the superior right corner.
When clicking on “Applied Configurations” an opportunity for the user to change one or some information is presented to run the report again.
Cases in which the data are presented differently:
On the condition to insert the Dimension filter, the grouping is not done by product name, and yes by which Dimensions the cost meets.
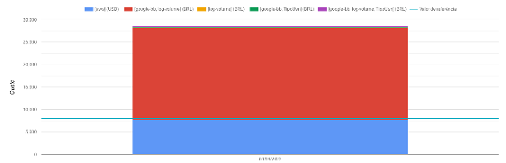
On the hypothesis of two Dimensions being added, and there is a cost that meets both. On the “Cost per Dimension” part this registry is inserted as “Dimensions consumptions per group”, that is, the amount of R$148,38… is present in the [google-bb] Dimension and [TipoUsn].
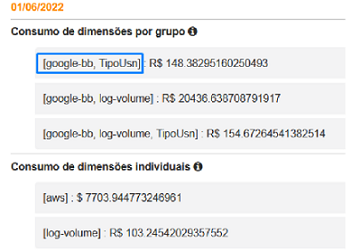
To make this understanding accessible to the user, a tooltip (context tip icon) was inserted in each type, which explains to the user how it works.
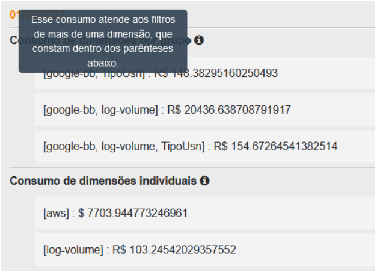
2. Saving a cost limit configuration (Creation)
To save a configuration, it is necessary to do the “Step by step 1”, shown previously.
Then, the user must search the third card “Applied Configurations” and press “Save”.
Therefore, this configuration is kept saved for the report execution.
3. Executing from a saved configuration
After following the “Step by step 1 and 2”, the user must click on the Refresh action to reload the existing configurations list. The icon to update the screen is evidenced on the image below:
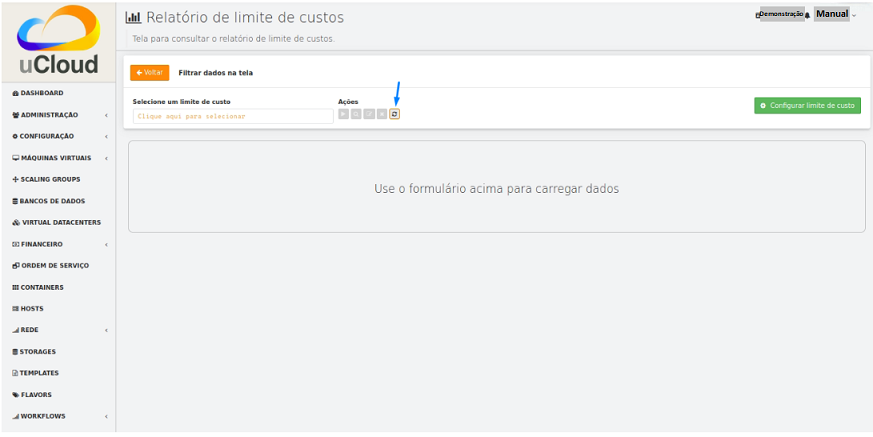
In the sequence, the user must click on Select a cost limit and a screen is shown to select a saved configuration from its name.
In this scenario, four other options of “Actions” are released for the user, according to the list and image followed:
Execute;
Edit;
Filter by period;
Delete.
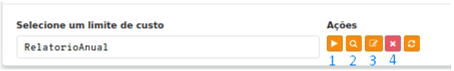
4. Editing a cost limit
To edit, the user needs to select a cost limit, and press on Edit, third button located on the “Actions” part.
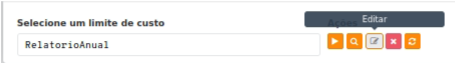
In this flow, the “Cost limitEdition” is shown:
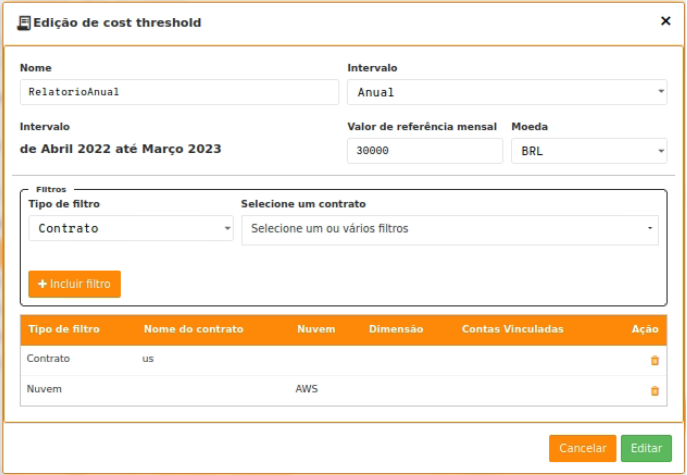
On it, the user can change the cost limit configuration and save, pressing on the Edit, green-colored button, located on the right inferior corner.
5. Deleting a cost limit
After the user selects a cost limit, they must click on Delete, fourth button on the “Actions” part:
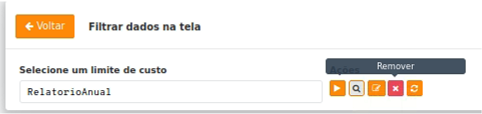
To finish, it is necessary to update the cost limit list to check if the information is no longer being displayed.
6. Filtering by period
The user needs to select a cost limit, and then click on Filter by time period second button on the “Actions” part, represented by a magnifying glass.

In the sequence the “Customized search by period” modal is presented:
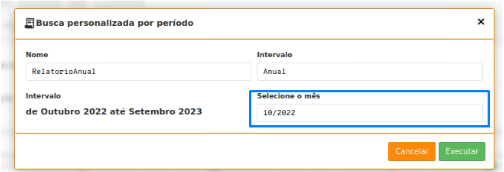
On this modal, the user can observe the name and the selected cost limit period, being possible to change the start month of the period.
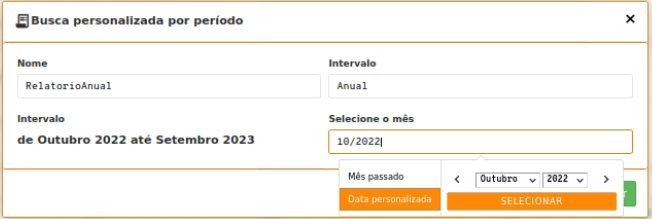
After making this change, the user can press Execute and process the selected cost limit, with the filters that are present in the cost limit. However, now in a different time period.
Rules:
The user can only go back until the month in which the cost limit was created.
It is not possible to select the start month as being superior to the current month.
7. Generating projection for the following months
In case the user selects a quarterly, semiannual or annual period, months ahead of this period are used, that way, a projection is made based on the last 6 (six) months of registries.
On the figure below, this projection period is presented on the “Dynamic cost threshold” modal:
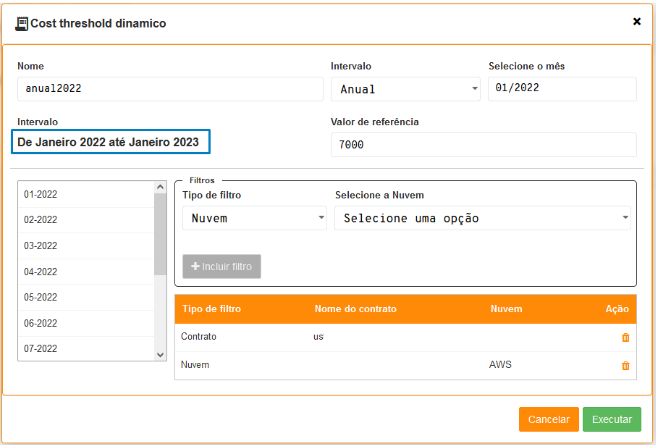
After loading the information, it is possible for the user to note that, when generating a report, some months have an asterisk (*) next to it.
Atenção
This asterisk next to the month means: “Projection”. It is based on the information of the last 6 months. Therefore, the period that still occurs can be drawn from the use of past information.
Nota
The base of the last 6 months projects the months ahead that are shown with an asterisk.
Beyond that, there is a subtitle on the graph that informs which consumption period used to generate the projection.
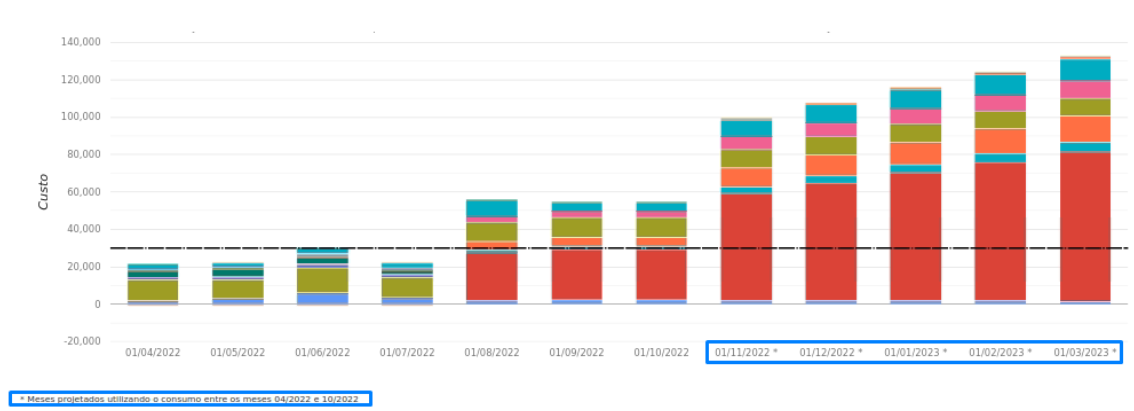
And on the information of cost by product name or by dimension, the name “projection” is shown next to the months that were generated through this projection.
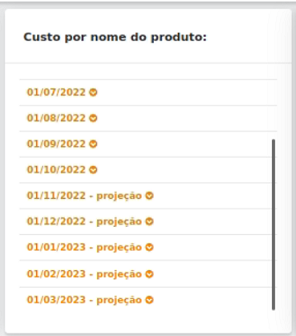
Possible error messages:
Below are listed some error messages that the user can receive when running the cost limit report:
There are no data that meet this filter
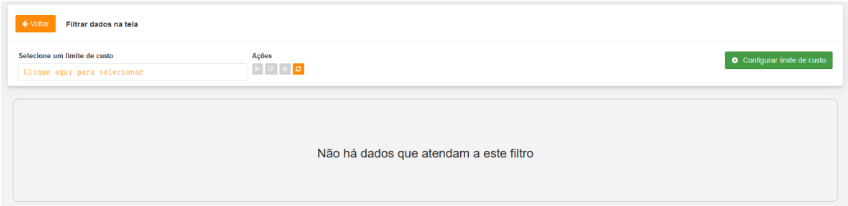
It happens when the user builds a filter that does not have any registry that is suited for this configuration.
It is not possible to make this processing yet
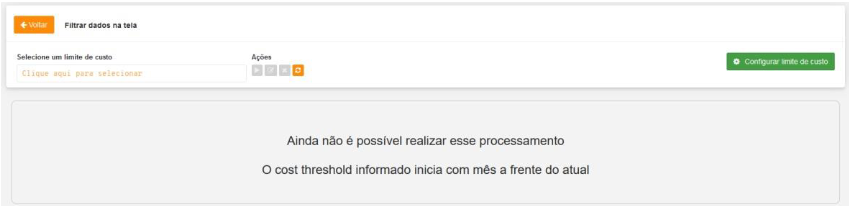
Occurs when the user “Filter by period” and informs a month after the current month.
Tip to avoid this type of problem: just put the start month as a current or previous month.
Invalid cost limit
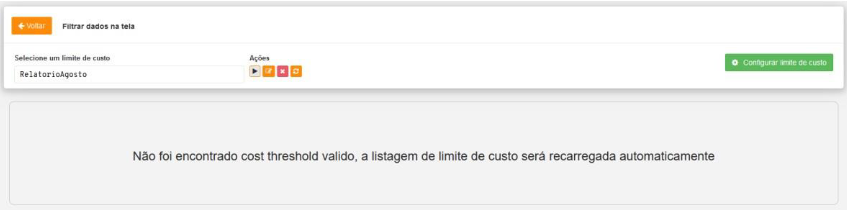
It happens when the user clicks on Delete and right after presses to Execute the same cost limit they deleted. The user does not need to worry, in 5 seconds the list is reloaded and removes the cost limit that was deleted.
To avoid this problem occurring, press on the button referring to Refresh after deleting it.
It is not possible to generate the costs projection
Nota
It is necessary to have at least 6 months of data history.
It occurs when the cost limit end date is superior to the current month, being necessary to generate the cost projection for the future month and at the processing moment it is verified that do not exist 6 months of previous data to get this projection to be generated.
Start date cannot be previous to creation date
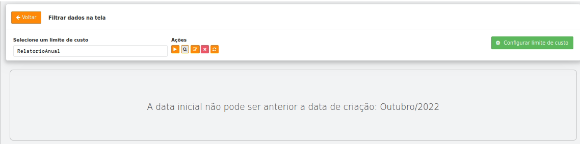
It happens when the user clicks on “Filter by period” and informs a start month previous to the cost limit creation date.
B. Risk analysis
The risk analysis report allows that from a saved cost limit, it is possible to make an analysis and display the current consumption on screen, the predicted consumption for the current month, and what is the risk of the consumption exceeding the cost limit previously defined.
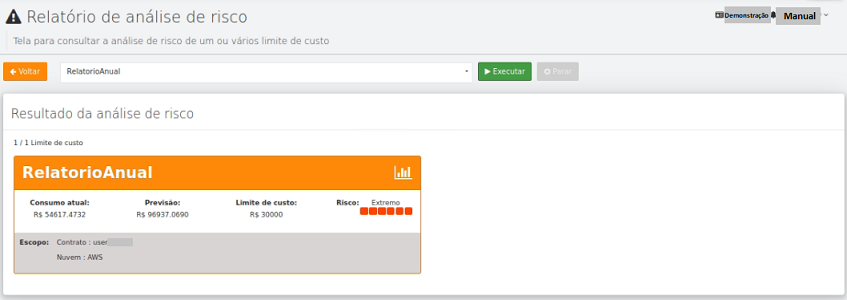
Step by step:
At this moment it is informed step by step to make these actions in the cost limit screen.
1. Executing a risk analysis
To make the processing it is necessary for the user to create a cost limit on the “Cost limit report” screen, after that they can access the “Risk analysis” screen and on it are listed all the saved cost limits.
From this moment, it is possible to select one or more options, to make the risk analysis processing based on the cost limit configuration, as shown on the image below:
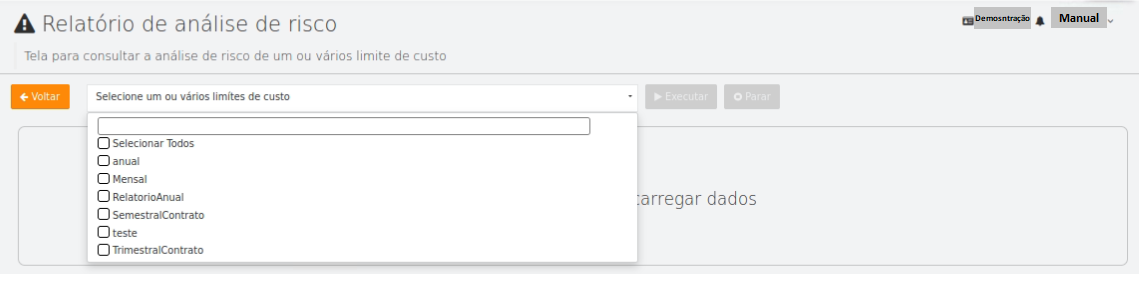
After making the processing, the user can view the:
Current consumption;
Current consumption prediction;
Cost limit;
Risk of the current consumption exceeding the cost limit.
Beyond that, it is also presented on the scope of each cost limit, presented the company name in which it is inserted, the cloud and/or if there are linked accounts.
When selecting the desired options, the green-colored button Run next to the drop down menu is available for clicking. In this example, the user selected the following cost limit options: annual, monthly, AnnualReport and Quarterly/Company.
Observe the image below for better view:
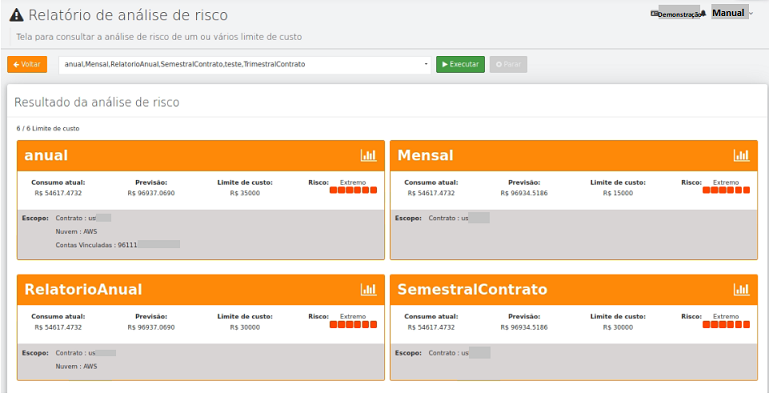
In the previous image it is possible to observe a scale containing the risk level. For a better comprehension of the risks, the user must click on the orange-colored button on the inferior right corner of the screen, represented by a white arrow pointing to the right side.
When being pressed, a table is opened where the user can view the description of each type of risk that can be informed on screen. The risks can be presented as:
Unavailable;
Very low;
Low;
Moderate;
High;
Very high and
Extreme.
Next are images for better view:
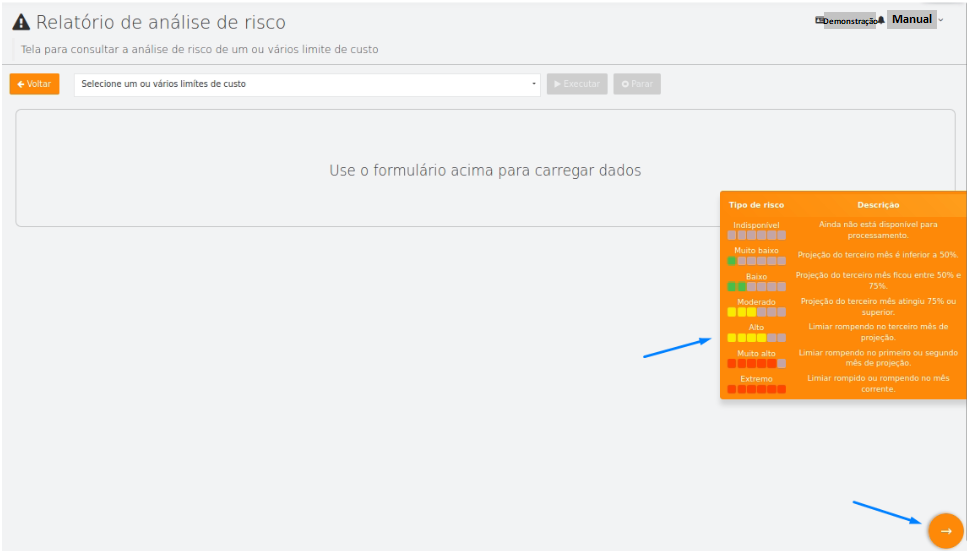
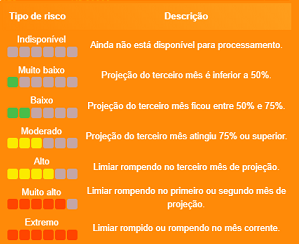
It is noticeable that when going through one level to another, the colors change. The unavailable risk does not present any color, while the low and very low risks are represented by the color green.
The moderate and high risks are shown in yellow, and the very high and extreme are exposed in red.
2. Generate cost limit report from the risk analysis
After the risk analysis process is done, the user can click on the graph icon, located on the superior right corner of the card, generated on the result.
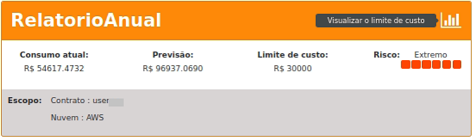
Then, they are redirected to the cost limit report screen where the automatic cost limit processing in which was clicked.
3. Generate risk analysis from the cost limit report
After the user runs a cost limit already saved, a new option is shown on the “Applied settings” part, where is redirected to the risk analysis screen, processing automatically from a processed cost limit.
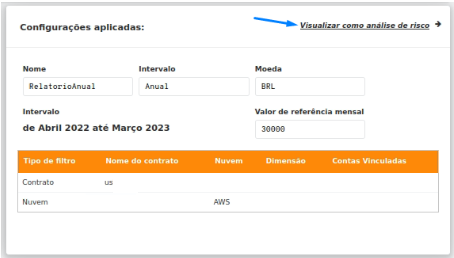
Invoice based-panels
The Invoice-based panels present billing value information uniquely regarding to an already closed period (previous month) for the payment in the next month. It is possible to compare the example of the «Credit Card» bill. In the bill there is only the consumption of the previous month, for the payment on the current one.
The values presented in this menu option must take into consideration that the uCloud platform has three types of user identified as “basic profiles”, as described below:
System users: they are the regular users that access the system to consume the resources.
Group Administrator users: they are users that are associated with a user group, they can provision and change other users in the platform.
Company Administrator users: they are users that are associated with a company and about this company they can define ticketing rules, provision and change other users in the platform.
When a System User starts a session in the uCloud platform, if this user has permission to view the Billing menu and the My Invoice option, the values presented in the reports refer only to the computing resources this user is linked to, because it has permission to view the «Invoice» menu and its costs. This user does not have permission to view the Invoice values of another user or Group to which it belongs, nor the total value of the Company.
When a Group Administrator User starts a session in the uCloud platform, the values presented in the reports refers to the computing resources values of this user and all the users that are linked to this Group. This user does not have permission to view the total value of the Company.
When a Company Administrator User starts a session in the uCloud platform, the values presented in the reports refer to the computing resources value of this user. This user has the profile to permit visualization of the total accumulated value of the Company(ies) to which its user was provisioned in the Administrator field. Consequently, this user can view the consumption in the groups that was (were) linked to the company(ies), and finally the values of all the users that are linked to the Groups.
To illustrate this report and its values, it is used as a credential with the Company Administrator User level in this document. The images used are merely illustrative and must only be viewed as examples.
My invoice
Billing
Consolidated Billing Report (CBR)
This submenu option allows the user to consult consumption reports that make the governance costs of cloud computing resources possible, in a very granular way and with the presentation of values in Cloud Service Unit (USN).
Atenção
Cloud Unit Service (USN) is a pricing template of the cloud services, designed to the entities and public agencies integrating the Brazilian governmental sphere. It aims to establish as a predictable, linear and flexible method for obtaining a specific quantity charged for the cloud computing services.
Accessing CBR
To access the report, the user must click on “Billing”, located on the functionalities menu on the left side of the screen, and then click on “Reports”.
When the user selects this option, the uCloud platform presents the following screen:
According to the example above, it is noticeable that the billing menu is divided into two groups: “Consumption-based Panels” and “Invoice-based Panels”, the Consolidated Billing Report is located in the second group.
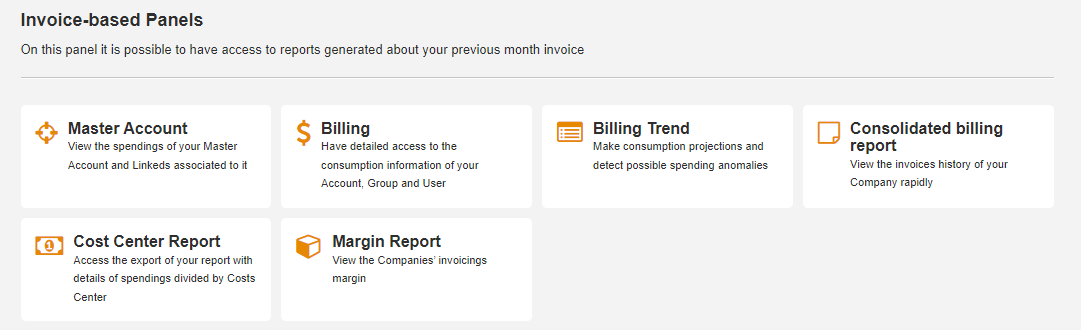
By clicking on the corresponding button, the uCloud platform presents the following screen:

Selecting CBR
The user can select a period and a company to search the invoice history, when clicking on the blank to insert the date, the uCloud platform delivers a screen with the calendar, so it is possible to select the desired period (in it, it is possible to run through the previous months and years), after the date is selected, the buttons available to the user are: Cancel and Apply:
CancelButton : It can be used by the user, in case they want to quit the selection.ApplyButton : It must be pressed after selecting the search period.
On the blank to search the intended company, all the companies registered on the platform are presented. According to the demand, a complete search can be done when clicking on the Select all option or a directed search, the user just needs to click on the companies of their interest.
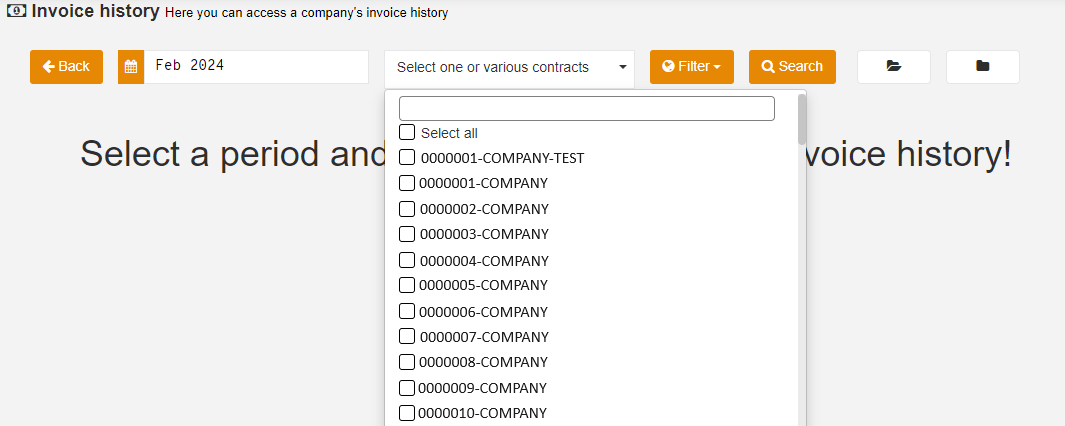
The Consolidated Billing Report makes 5 types of filters available, that can be used by the user, these are:
Proposal ID
RC
Company Number
PO Number
Product
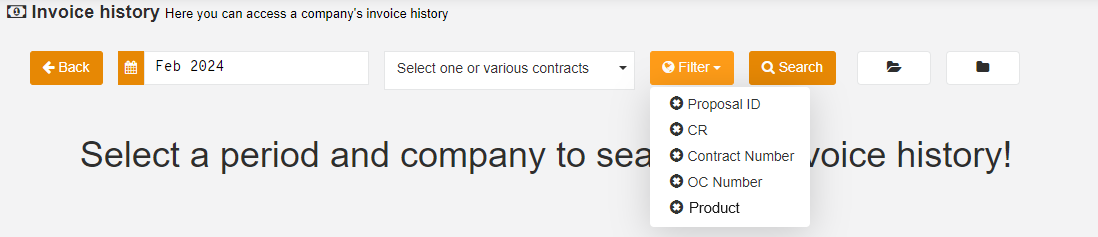
The filters chosen by the user keep filled in orange, in case no filters are selected the option presents itself with no mark. On the example below the Proposal ID and Company Number filters were opted by the user.

Finished the Consolidated Billing Report data selection, the user must click on the Search button.

In case the user wishes to redo the search, just click on the Back button and restart the whole process.
Atenção
On the top right corner are the icons of the options to open and close invoices.
On the cut out of the superior right corner of the screen, the following image presents the icon “Generate all invoices” turned on.

They allow the user to determine both actions on the desired period, about all the existing companies that can be searched, individually or in specific sets.
When enabling the invoice opening, the modal is presented:
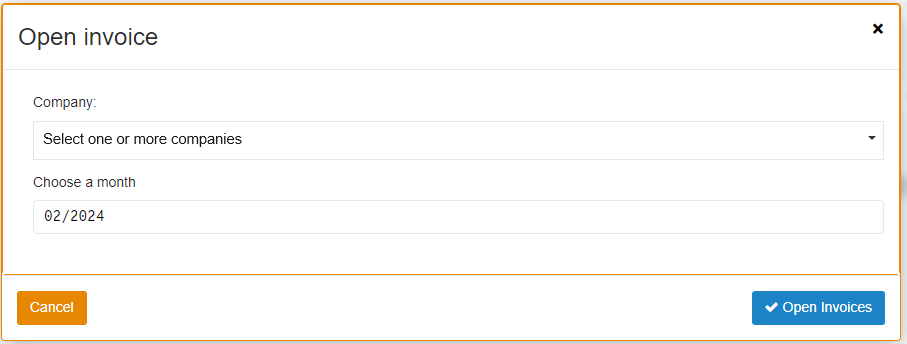
After the user selects the blanks according to the desired, the company and the month, the Open Invoices button is enabled for it to be clicked, as soon as the operation is done.
When enabling the invoice closing, the modal is presented:
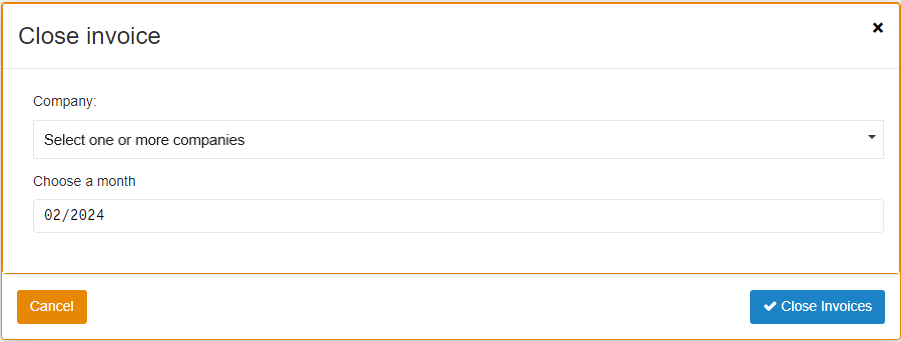
After the user selects the blanks according to the company and desired month, the Close Invoices is enabled and presents a green color for it to be clicked, as soon as the operation is done.
At any moment, the Cancel button can be pressed, in both cases detailed above.
Following CBR search
When clicking in search, the user must schedule the uCloud platform to search the requested information, the referred action can take a few minutes according to the following example.
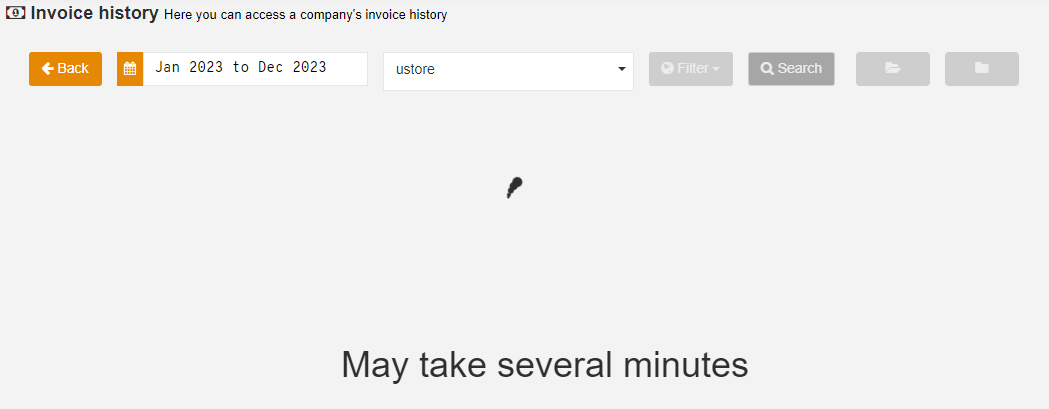
Done with the search, in case there is no information regarding the filters selections, the uCloud platform informs that there is no invoicing history for the company on the informed period.

In the existence of information, the uCloud platform evolves for two types of scenario:
On the filtering evolution and data search, the number and name of the existing companies that present failure on the search values are shown on the left side of the screen and displayed in red, according to the example:
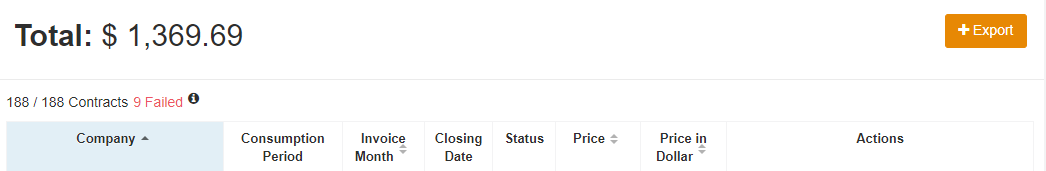
Atenção
User, if this happens in your search, please get in touch with the uCloud platform support.
Following the data search flow, the companies found are listed:
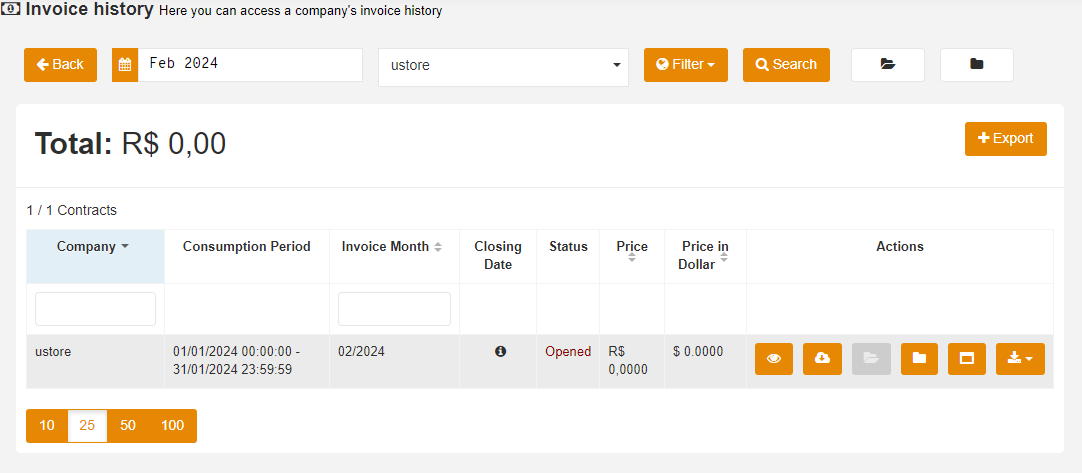
Listing companies in the CBR
Done the information loading, the platform shows a list of the companies found according to the search done by the user, the screen shows eight columns:
the name of the referred companies;
their consumption periods;
the invoicing month;
closing date;
their status (Closed ou Opened);
price;
cost in USN
Actions.
This last column: “Actions”, includes the four buttons listed below, according to the following image:
View details
Download
Open Invoice
Close Invoice

In case the company’s list is very long, the scrollbar functionality allows the user to browse in all the screen length, up and down.
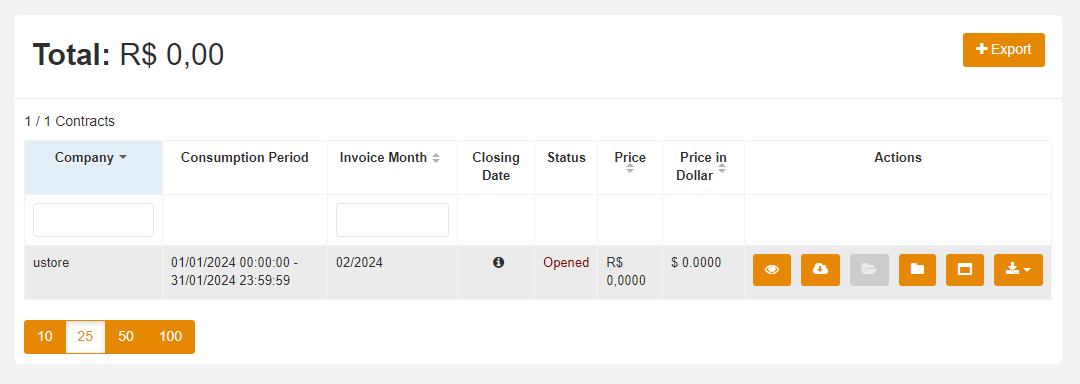
Below there are detailed information of this screen:
Total: Total value of the searched companies invoicing. The uCloud platform automatically converts the values in USN to Real (BRL), which allows the user to evaluate the value in the currency.
Exportbutton : This button allows the user to export the information of all the filtered companies, in MS-Excel (.xlsx) table format. The uCloud platform downloads the file in the user machine and exports the information with the name “invoices.xlsx” in the directory/folder configured on the browser options that the user is using.
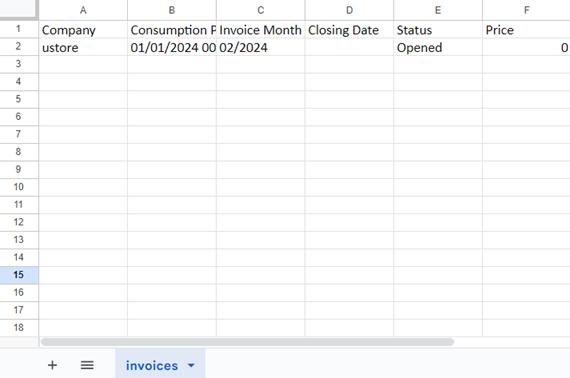
On this flow the columns of the “Listing companies” screen are detailed:
Company: Presents the name(s) of the company(ies) filtered in the search.
Consumption Period: Displays the start and end date of the month which the financial value is being accounted for. Also showing the start and end time of each listed information. The consumption period is always previous to the invoice month.
Invoicing Month: Shows the month in which the invoice expired and must have their payment made. This is always the month following the consumption period.
Closing Date: This column informs the user if the invoice is open or closed. For the companies that present the “Open” status, it is shown the tooltip icon, asking the reader’s attention for the message: ”The closing date of your invoice was not informed because it is still open”, shown in the following example. While the companies that present the status “Closed”, expose the date and time of the invoice closing.
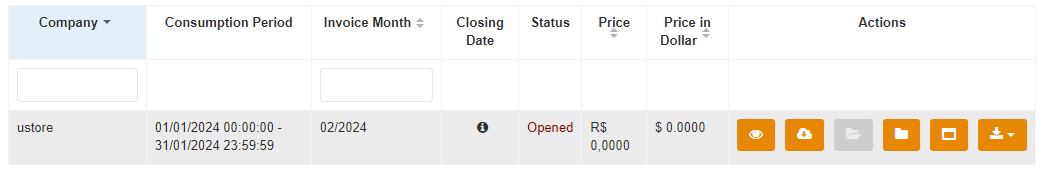
Status: Presents the invoice status, there are two types: Open or Closed.
Price: Shows the total value of the month invoice, it can be displayed in Real or Dollar, according to the company policy. In this example, the value is expressed in the Brazilian currency (Real - BRL).
Cost in USN: Displays the total value of the month invoice, expressed in Cloud Service Unit (USN).
Nota
The four columns: company, invoicing month, price and cost in USN enable the alternance of presented data.
Detailing CBR actions
The last column of the listed companies is the actions one, it presents 4 buttons: View Details, Download, Open Invoice e Close Invoice, the detailed function of each one follows next.
View detailsbutton: When clicking on this option, the user can view the details of the invoice company. For the invoices with the “Closed” status the uCloud platform presents the screen below:
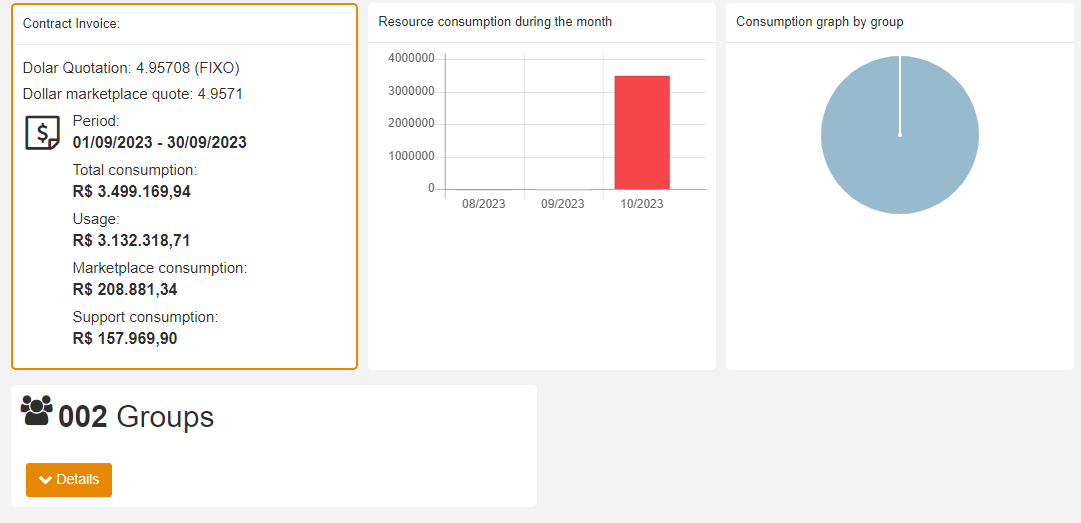
On the first card “Company Invoice” it is possible to view the dollar quotation on the date that marks the start of the invoice of the company in question, along with the total value of the consumption on the previous month to the selected invoice.
For example:
If the selected invoice corresponds to the month of November, the consumption values presented match the previous month, that is, October.
Following the detailing flow, the second card “Resource consumption during the month” shows a bar chart. Besides it, the “Consumption per group chart” indicates the consumption of the consumptions per group, displayed in a pie chart, both graphs represent a visual resource that helps the user understand the data of the selected company.
The last card “Groups” shows more specific information about the groups that use the company, the user can click on “Details” and the platform delivers the groups name and the costs that each one represents the total value of the company.
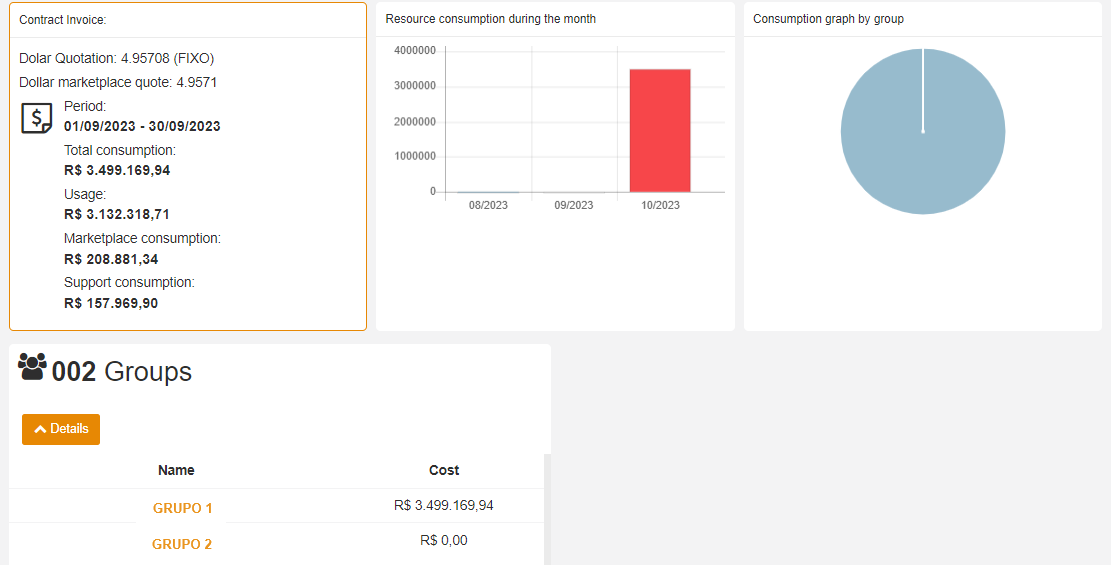
The Export button, located on the top right side of this screen, offers the possibility of the user to download the files in the CSV and PDF formats.
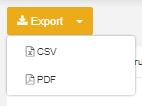
In the PDF format, the file is immediately downloaded. On it, there are summarized companies’ information, which are the same ones presented on the option “Details” explained previously.
See the example:
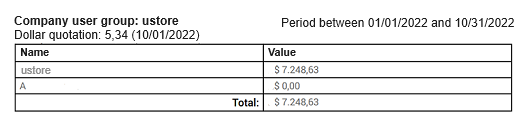
If the user needs a file with the totality of the invoice items list, they must click on CSV to download a file of the electronic spreadsheet type (MS-Excel). Done that, the uCloud platform presents a modal called “Generating New Report”.
In it, an email is requested for the user to be informed about the finished file production and its availability for viewing, the adding of the email is optional, in case the user does not want to be informed, just leave the blank with no filling.
On the screen it is possible to schedule the production report for a specific date or if the production follows a recurring date.
Use case:
Obtain the report on CSV format
To obtain the report on the CSV format there can be two types of situation:
In case of not existing no reports generated by the system yet, the option to download the last generated file does not appear enabled. The report creation must be requested, clicking on the option
Generate Report, according to the example:
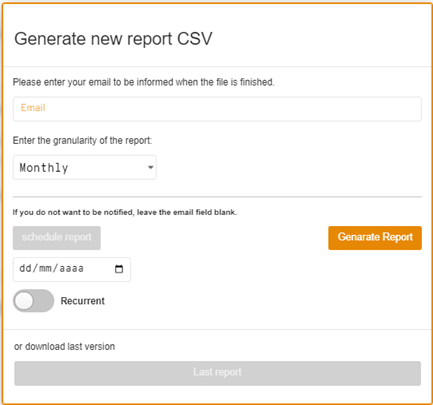
Done with the last action, on the Tasks menu icon, located on the top right side, the uCloud platform presents an alert informing that a new report is being generated.
Nota
On this step, the user can track the evolution on the Tasks menu.

When clicking on the tasks icon, the platform shows a new screen according to the image below, informing the action status, in this example, the invoicing file of the company has been generated with success.
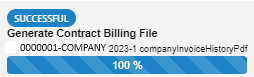
To obtain the report, the user must click again on the Export button, and when selecting the CSV option the screen presents the button enabled in the color orange. In this example the message availables to download the file generated is “Last file generated on 2023/01/18 14:11:45”.
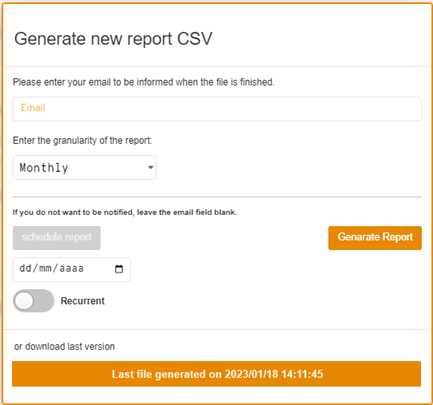
When clicking on the button, the download of the CSV file is done and is available for the user, according to the following example:
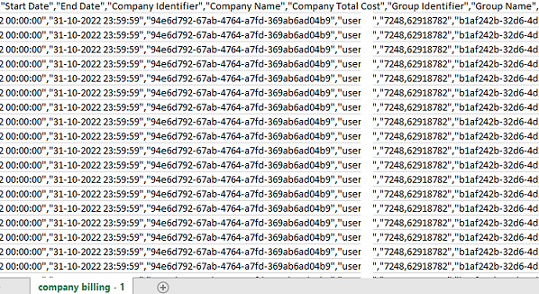
In case of a generated report, when clicking on the option to download the file on CSV file, the button appears enabled in the color orange, consisting of the date and time of the moment of its creation. It is up to the user to decide if the obtained data of this date are the most adequate to their search or if it is necessary updated data.
To update and produce a new report the user must click on the button Generate Report and repeat the process of the case use, previously presented. View the following example:
For invoices with the “Open” status, the platform displays the following screen:
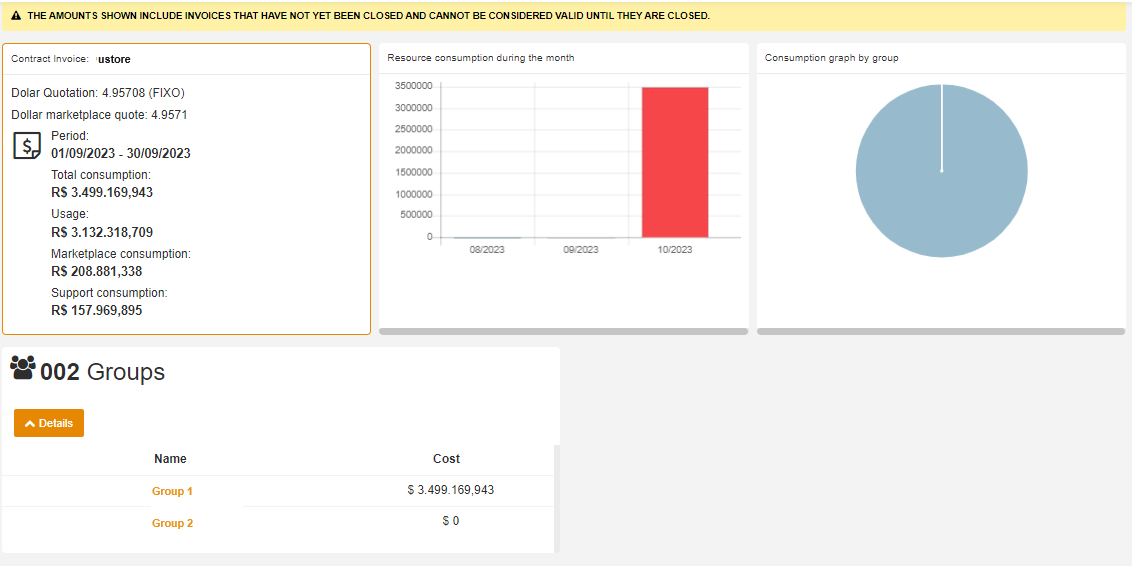
On the screen there is the same information presented on the “Closed” status screen, although as the invoice is still open the message ”The values presented include non-closed invoices, and cannot be considered valid until their closing” is shown in highlight.
Nota
All the procedures on the “Closed” status about the obtaining of the files in PDF and CSV file can also be done when the status of the invoice is “Open”.
Downloadbutton : In case the user already knows the information regarding the listed company and desires to download all the invoice items list in a electronic spreadsheet type of file (MS-Excel), just click on the
 Downloadbutton, and theGenerating New Reportmodal is presented. For the user to obtain the CSV file they must follow the same procedure presented in Use Case, check here.
Open invoicebutton : This button is only available for the invoices in which is with the “Closed” information; to open a closed invoice means that the business needs some corrective action on the invoice value, that must be arranged before the payment of the referred value presented.
When clicking on the button the following screen is displayed, it is up to the user to confirm or cancel the action.
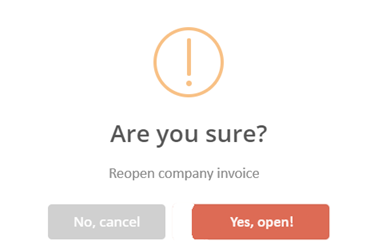
Close invoicebutton : This button is only available for the invoices in which their status is with the information “Open”; on the “Closing Date” column in case the user hovers the mouse over the attention symbol, it is shown the message: “The closing date of your invoice was not informed because it still is open”, according to the following example.
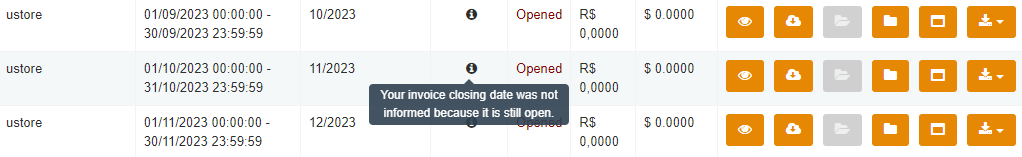
When clicking on the button a confirmation screen is shown, it is up to the user to confirm or cancel the action.
Billing Trend Report (BTR)
The Billing Trend Report (BTR), briefly named as BTR, is based on invoices that refer to financial value information about a closed period. It allows the user to consult information related to a company’s invoice, and details the visualization from a monthly filter.
This report enables the detection of any spending anomaly, based on certain analyzed contracts. Proportioning an analytical and complete view in two formats: - Product name and - Tag.
From the invoice reports it must be possible to execute the billing trend rules, it can project the expenses up to 6 months ahead.
On the sequence the consult flows to based-invoice information, that shows the application of available filters and the online graphics presentation, as well as the possibility of the file download in .xlsx (Excel) format for later use.
Accessing the BTR
To access the BTR, the user just needs to click on the Billing menu and then on the Reports submenu, as shown in the figure below:
This screen is divided in two groups: «Consumption-based Panels» and «Invoice-based Panels», the BTR is found on the second topic, highlighted in the following picture.
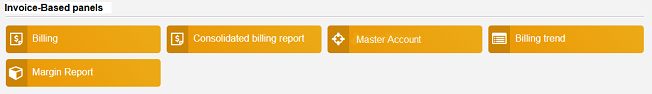
Creating a BTR
When clicking on the Billing trend button, the platform presents the following screen:
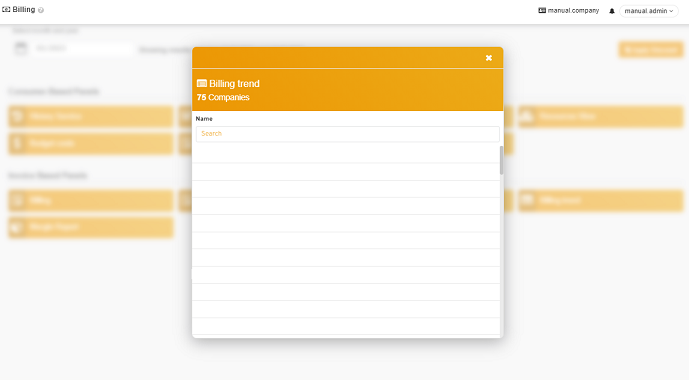
In this image, it is possible to view the companies linked to the logged user. This modal allows the search by company name with help from the search bar, when finding what desires just select it and a new screen is presented to proceed with the consultation.
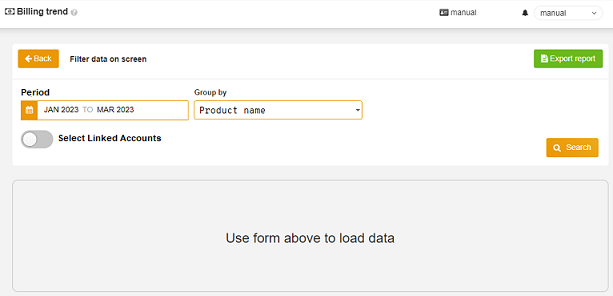
In the image above it is possible to see the following functionalities:
BackExport reportGapGroup bySearchSelect Linked Accounts
Importante
The Select Linked Accounts functionality is only made available if the user has Linked Accounts in the selected company.
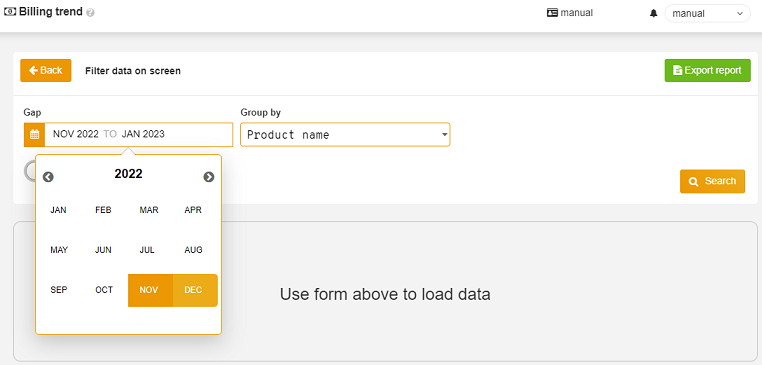
To create a BTR on this screen, the user must start the procedure by selecting the gap, where it is necessary to choose the months on the presented calendar, and click on the start and end period to obtain the desired report.
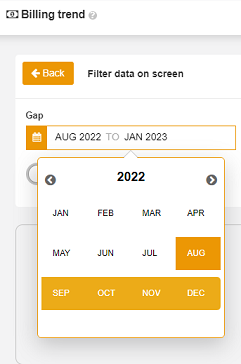
If the user wants to select any month from the previous or after years, just click on the arrows to the right or left. In the example displayed above, the gap selected regards from Aug/2022 to Jan/2023.
After that, the dropdown menu next to the blank regarding the Gap, the user must select the type of report grouping: by product name or by tag, and click on the Search button.
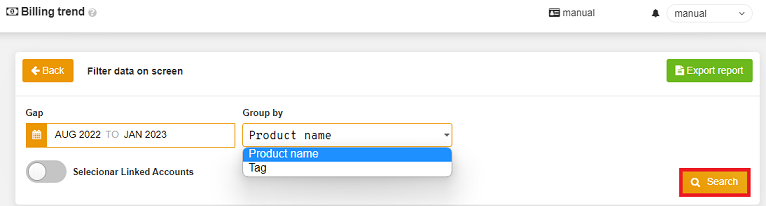
The following example regards a consult by tag and the uCloud platform presents an alert screen with the warning message, as shown below. To continue the search the user must click on the Ok button.

To download the searched data, just click on the green-colored Export report button, located on the right corner of the screen.
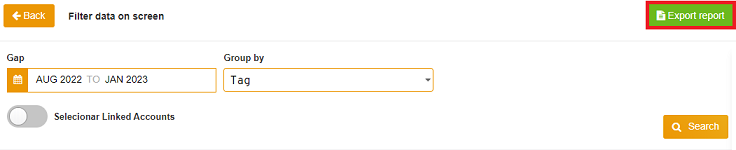
A new modal is presented, and for the exportation to be concluded, it is necessary to fill out all the blanks, as shown below:
Gap: Divided into monthly, weekly and daily.
Period: To select a period, just click on the initial and end month. In case the user needs a month from the previous or later year, they must click on the arrows next to the year shown to go backwards and forwards, as mentioned previously.
Type: Presents the options of Resources and Tag.
The last step of this modal is to click on the button Export report so the «Generating New Report» screen is presented.
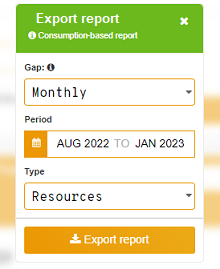
On this modal, in case the user wants to be notified, it is necessary to fill the blank with the email.
If the user wishes to schedule the report, just select the date, and click on the option: Schedule report, that is made available as soon as the date blank is filled.
On the condition of recurring schedule, it is only needed to click on the button located right below the date blank.
In case it is desired to generate the report for the first time, just click on Generate report.
If the user wants to download the last generated file, they must continue the flow described next.
How to download the file
After confirming the task success, the user must retake the steps to return to the Reports page, as well as the process to export the data, after the modal Generating New Report is shown.

To download the BTR file in .xlsx (Excel) format, the user must click on the button Last report generated in located on the inferior part of the modal, followed by the date and time in which the task was shown as successful on the Tasks menu.
Nota
The button for download is available only after the task presents the successful status.
Following the download on the Tasks Menu
When requesting the generation of a new report, it is possible to track the task evolution on the Tasks Menu, according to the image below.

The file is downloaded in .xlsx (Excel) format, as presented next.

Viewing the BTR
As mentioned previously, there are two types of visualization on the exportation to obtain a complete analysis of the report:
Product name
Tag (.csv file blanks detailed)
The BTR has the possibility of filtering by product as well as by tag.
From this first filter, all the chosen companies resources must be displayed (whether it is divided by products name or by tags), showing specific information about each one of those, with four metrics:
Average spending
Spending tolerance
Mobile average
Cost
Grouping by product name
The first report screen to be displayed is the general information about the company, where the left side is presented with a chart about the total expenses per month.

To project the cost, the user must select the projection month on the superior part of the screen, and click on the Project cost button. Next, a new column is added on the charts presented throughout the report.

If the user wants to remove the new bar, just click on the Clear button next to Project cost.
Right below, the resources report area, is displayed the total number of resources presented on the chosen company, and four values are shown:
Highest Average Spending
Lowest Average Spending
General Average Spending
Total value
On the right side, the chart is presented with the spending projection of each month within the selected period.

When opening the report it is possible to notice an orange-colored button on the right corner of the screen, represented by a white arrow pointing to the left side.

Clicking on this button, a tab is expanded with the products names of this company. With the search bar help, it is possible to look for a specific resource, and when clicking on it the user is taken directly to its chart.

In case the user has followed the flow for the report exportation for offline viewing, the file is presented the following way:

On this example of offline report, it is noticed nine columns, they are:
Created by
Product name
Product family
Usage type
Cloud identifier
Linked
2022-11
2022-12
2023-01
The last three columns refer to the year and month of the selected period, in the case of this example from Nov/2022 to Jan/2023.
Grouping by Tag
When grouping by tag, a dropdown menu is presented on the company area with the following filtering options:
All the tags
Metric
Name

In case the user has followed the flow for report exportation and offline viewing, the file is presented the following way:

This example of offline report displays ten columns of information, listed next:
Created by
Product name
Usage type
Cloud identifier
Linked
Tag
2022-12
2023-01
2023-02
The last three columns refer to the year and month of the selected period, in the case of this example from Dec/2022 to Fev/2023.
Filtering by anomaly
It makes it possible for the user to filter by anomaly within the company analyzing all the resources. For that, there is a flag to «Show only anomalies» with the option to trigger it or not. By triggering it, the resources displayed on the screen are reduced, presenting only those that really have spending anomalies.

The representation of an anomaly is given through the limit overtaking the calculated spending based on the rule of the third quartile formula. When clicking on the tooltip next to the flag «Show only anomalies», the following message is displayed:

In case the anomalies are inexistent, a warning is shown on the details screen of the report company, as shown in the image below.

Besides this warning, no chart is presented.
Although, in case there are spending anomalies, a column of distinct color shows on the charts, as presented on the following image:

Linked Accounts
In case the user does not have accounts associated with the company, a message is presented under the date: «This company does not have Linked Accounts».

Although, if the user has accounts associated with the company, they can view it through the triggering of the flag «Select Linked Accounts» as the example presented.

When triggering it, the accounts associated with the company are displayed right below the flag that keeps the orange color. And the accounts are released for selection, as the following image.

After selecting a desired account, the charts regarding it are presented the same way as presented previously (Viewing the BTR). It is also possible to opt for all the presented accounts, in this example there are two linked accounts.
In case it is desired to forget the selected account, the button Clear next to the listed accounts must be clicked.
If it is of the user’s interest to export the Linked Accounts data for their machine, it is only necessary to follow the steps described previously on the topic: How to download the file.
Utilities
Resuming the subject about the current corporate organizations adopt the cloud as a solution to manage their environments, sometimes, a combination of private and public clouds.
The great challenge is the management of these hybrid multi-cloud environments, to reach a unified vision and obtain the financial costs, once each company has a type of necessity and faces different challenges.
In this hybrid multi-cloud scenario, the computing resources need financial governance and the uCloud platform provides the management of these resources used in the environments. It is through the billing menu that the user can have access to several ways of viewing the evolution of costs regarding the computing resources consumption.
The platform organizes the optimization of these costs by standardizing and placing billing limits as well as quantitative and qualitative from the computing resources obtained in the multiple cloud providers. Besides the existing panels, the Reports submenu innovates by enabling the implementations: Dimension and Virtual Tags, utilities functionalities that favor the reports detailed next.
Dimension
Dimension is a new implementation of the uCloud platform, and was created to group tags of different nomenclature, but that are part of the same context, that are tagged in distinct clouds. That way, it avoids equal resources being tagged differently.
For this, logical operations and a filter were elaborated, with the intention of identifying in Billing which resources belong to a certain dimension. To better understand the two points that build this concept, observe the following examples:
It unifies a set of Tags that are different, but have the same meaning/role.
For example:
product: ETC
Product: eTc
producT: CTE
It is noticeable that the Tags above express the same thing, although they differ in their written manners. It is important to remember that these can be applied in different clouds, but in the same resources, where they should behave equally.
Thus, when unifying this group of Tags in a dimension, it is possible to identify all the resources that are within that context, and that way have a new way of visualizing the Reports, Budget and Forecast.
Creates logical expressions.
For example:
product: EFG & department: IT
In the example above, the expression represents that this dimension desires all resources to have the Tags: “product: EFG & department:IT”. This expression is considered simple, nonetheless, something more complex can be built from what has been implemented.
Creating a Dimension
To create a dimension, the user must click on the Financial menu, and then on the Utilities submenu, that displays two options presented on the next image:
Dimension;
Virtual Tags.
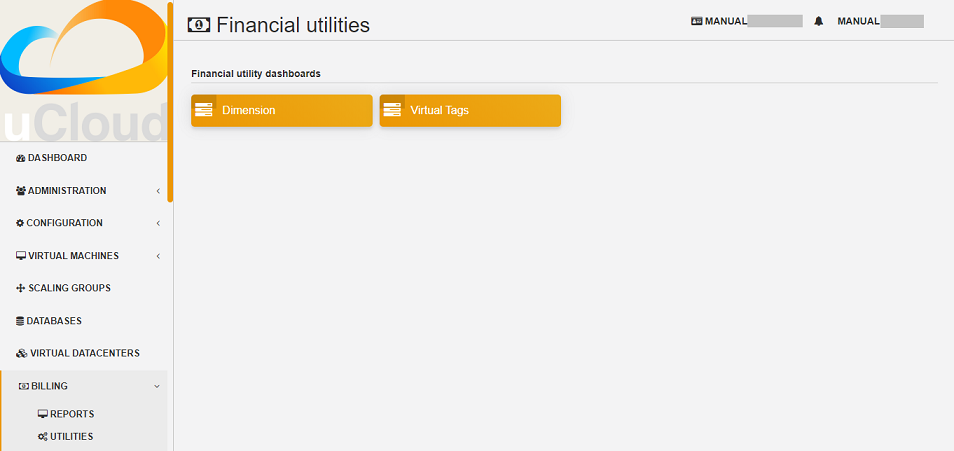
When selecting the “Dimension” option, the listing of dimensions generated previously is presented, as demonstrated in the figure below:
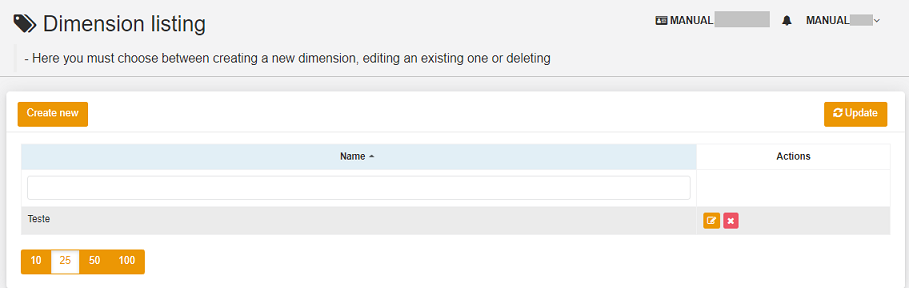
In case this is the first dimension to be created by the user, no list is displayed on the screen, as shown in the next image:
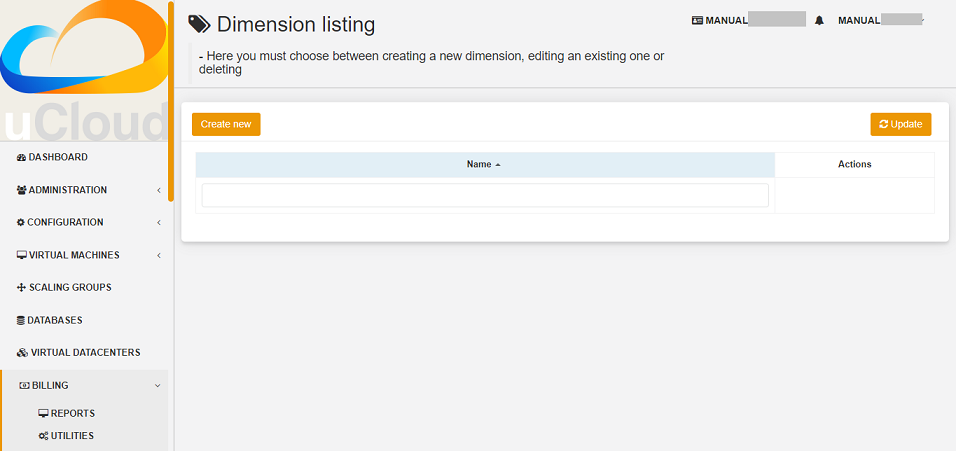
On the superior left side of the screen, the Create Dimension button is presented, which the user must press to start the creation process.
After clicking, the initial screen to create a “Dimension” is presented, as shown in the next figure:
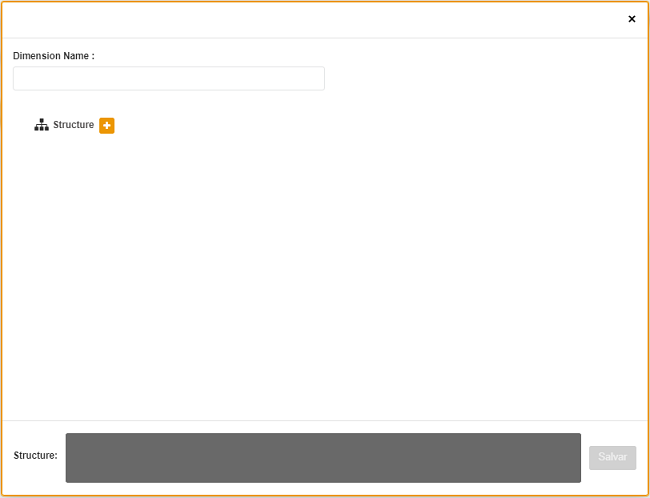
To better understand the function of each blank, observe the detailing of these below:
Dimension name: In this blank, the user must fill in the name of the dimension to be saved.
Structure +: This button presents two options that the user can apply in the structure of their “Dimension”.Tag Grouping;
Tag.
Atenção
It is important to highlight that this structure must be a logical expression thought previously. Therefore, to group tags is necessary to put them in a group first.
Structure: Corresponds to a block at the end of the screen, where the user has a better visualization of the structure that is being assembled.
Savebutton: After completing the data, the user must press on theSavebutton so they are not lost.
Creating a Tag Grouping
After filling in the “Dimension” name, the user must create a group for its structure. When hovering the mouse cursor over the “Tag Grouping” option, appears the following message:
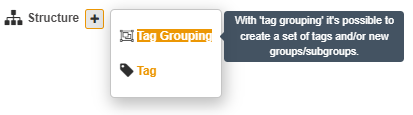
When selected, the group creation modal is shown, where the name of the group of Tags must be filled in and then saved.
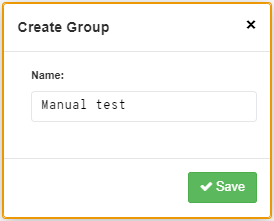
Once the action is performed, below the ”Structure +” function, the name of the created group appears, and beside it there are two action buttons:
Plus symbol “+” to create other group(s) or add Tag(s);
Trash bin icon to delete the created group.
Next to these icons, the following information appears :
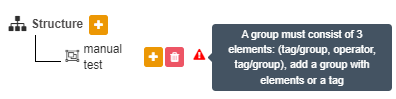
Atenção
It is important to note that in case the “Dimension” construction does not match the conditions presented in the message, the “Save” button is unavailable for activation.
In the image below, it is also possible to notice that in the Structure function, at the bottom part of the screen, the group is represented by ( ).

Creating Tag
By clicking on the plus icon + next to the created group and positioning the mouse cursor over the Tag option, the next message is shown:

When clicking on Tag, the Tag creation modal is presented:
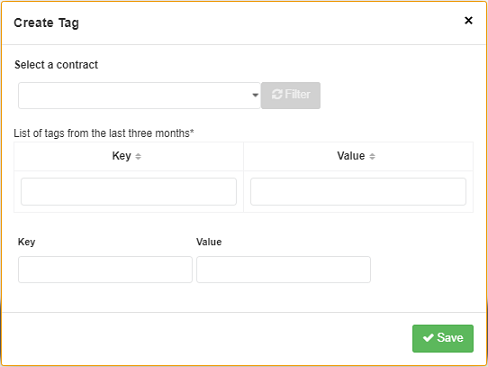
The first step for the user is to select one of the companies listed in the dropdown menu.
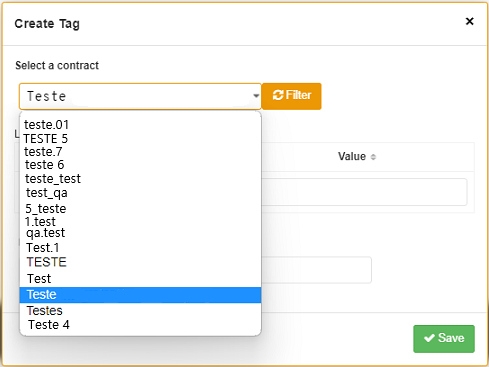
After selecting the desired company, the Filter button, next to the dropdown menu, is available for activation, as exemplified in the image below:

In case the company already has existing Tags, a list of Tags with the keys and values of the last three months is exhibited. The screen displays the number of pages below the listing and the information retrieved in blocks of 10, 25, 50 or 100 lines.
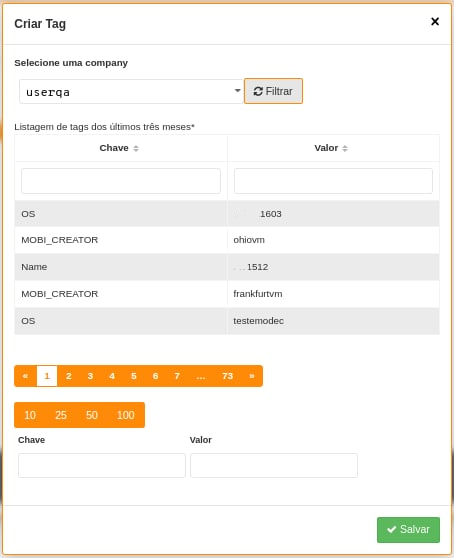
The user must select the desired Tag, shown in the list, and the Keys and Tag Value created are automatically displayed.

When finishing filling the modal, the user must click on the Save button on the inferior right corner of the screen.

If a company does not have Tags and the user wants to create them, just type the Key and Value on the last blanks, as demonstrated on the image above, leaving the central blanks empty.
Once this is done, the “Dimension” screen creation should be displayed as follows:

It can be seen, from the image above, that the “Dimension” has a hierarchy system, where first there is a group inserted in the structure, and only after the creation of the group do the Tags follow.
After the initialization of the process of creating a “Dimension”, it is necessary to add the other Tags of the same context to be part of the group.
To do so, the user must click on the plus sign “+” next to the Structure, which shows two logical operators </> OR and </> AND.
Using the logical operator
Logical operators are a part of the programming language, and they are used for the purpose of creating true and false expressions. These are intended to join two divergent expressions and elaborate a more complex conditional expression.

To better understand their application, information about the two operators used in the creation of “Dimension” is detailed below.
</> OR: In an expression, if only one of them is true, it is considered entirely true, and is executed.
</> AND: In an expression, if one of them is false, it is considered entirely false, and is not executed.
To better understand its usage, the user must follow the creation process.
Resting the mouse cursor on the operator option </> OR, the following message is displayed:
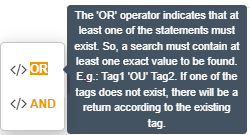
That is, even if one of the Tags is non-existent, the action is still performed only with the existing Tag.
When hovering the mouse over the </> AND operator, the following message is presented:
That is, when searching for Tags, if only one of the Tags does not exist, the action is interrupted.
In this example, the operator “AND” was selected and the confirmation of the action is presented when both structures are changed:
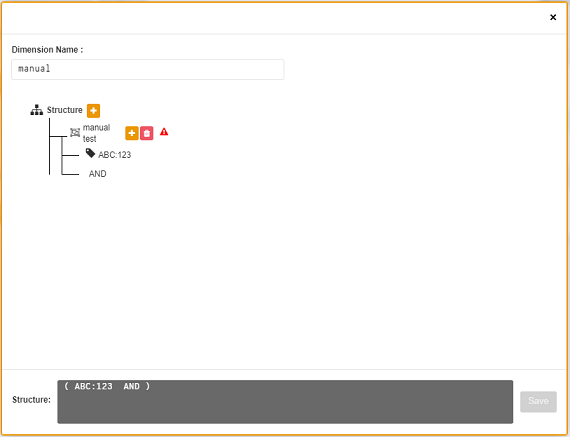
When finishing this first process of Tag creation, the user must create the second Tag, repeating the creation flow detailed above.
At the end of this step, the final structure of a dimension is displayed, and to store it, simply click on the Save button, located in the lower right corner of the screen, as presented in the image below:
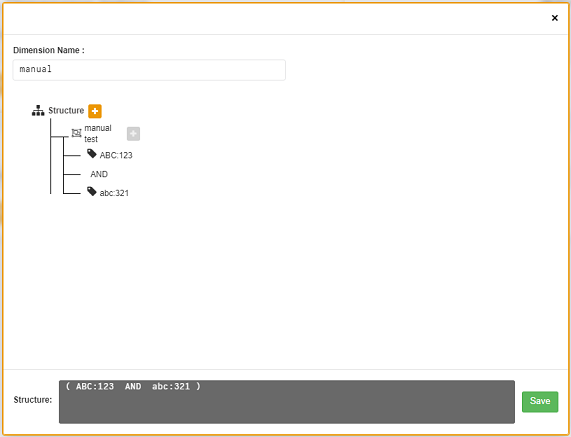
Upon completion of this action, the saved “Dimension” is shown in the dimension listing.
Listing Dimension
To list a newly created “Dimension”, usually the screen exhibits the listing. When consulting the “Listing Dimension” screen, if it does not update automatically, the user must click on the Refresh button in the superior right corner of the screen.
Then, the screen shows a list that must present the created “Dimension”, as displayed on the figure below:
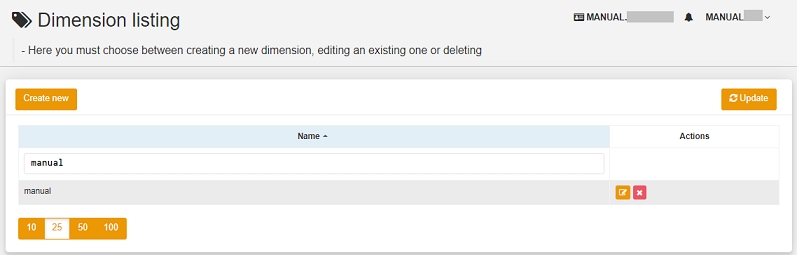
The screen above “List of Dimensions” shows the contract name superior, the symbol of the “Tasks” functionality and the name of the logged-in user in the superior right corner.
On this screen, the user can opt between creating a new dimension, editing an existing dimension or deleting a created dimension. It presents the two buttons that allow to Create Dimension or Refresh the list of dimensions.
In this list, the columns of “Name” and “Actions” are presented, the information can be personalized and retrieved by clicking on the blocks of 10, 25, 50 or 100 lines. The “Actions” column allows the Edit and Delete operations.
Editing a Dimension
To edit a Dimension, the user simply clicks on the Edit button in the “Actions” column in the “Dimension” list, as detailed below:
Doing this, the screen with the assembled and finished structure is displayed, as exemplified below. This example, using a new dimension, contains Groups and multiple Tags.
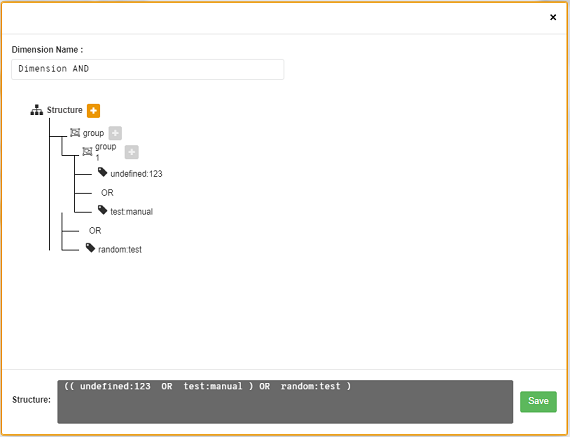
When looking at the figure above, observe the trash can icon. That is, the user has the possibility to create other groups and add more Tags, as well as delete them.
It is also possible to realize that for each action performed, the Structure, located at the bottom of the page, is modified.
For the alteration to be confirmed, it is necessary for the user to press the Save button, next to the Structure function, located in the lower right corner of the page.
Where “Dimension” is used
Currently, this implementation groups Tags and gathers them in the “Dimension” created, facilitating the categorized visualization in other functionalities of the platform.
Furthermore, the “Dimension” is used in the modal “Create Budget” included in the card named “Sub Budget Details” in disambiguation .
Virtual Tags
In a broad context, a Tag (a label) it’s a keyword that signs or identifies a particular computing resource (or service resulting from its existence) stored in a cloud provider, repository or database.
The Tags are a type of metadata, capable of providing information that describes the data, this facilitates automated search for information retrieval.
Atenção
A Tag is a label in which the user assigns a Key and a Value to a public cloud computing resource.
In the scenario of any type of cloud, the data contained in Tags is used together with other forms of tagging that the cloud providers use to classify information about their resources. Thus, the Tags help the research, organization, identification, management and, finally, the filtering of used resources in any cloud provider, for example: AWS, Azure, Google, among others.
These Tags (labels) after linking to a resource are used to categorize these resources so they can be classified by: purpose, property, criteria or location.
For example:
The user or the organization, can define a set of Tags for the Amazon EC2 instances of their account, to help track the owner and/or grouping level (stack values) of each computing resource of the public cloud consumed.

Nota
The picture above is an example and the information present is merely illustrative.
In the picture above, two virtual machines are used as an example of how to illustrate the link between Tag and resources. A detail that is mentioned very little is that the public cloud service providers don’t allow linking Tags to all their products and/or services (check the provider documentation to know which resources are likely to have a Tag linked to the resource).
In the example above two different Tags are linked to the same resource (virtual machine) in this way we induce that the financial reports by Tag totaled the cost value of the Tag twice (the same value in each Tags) and, for this example, in this situation double the cost within the same period.
But we must highlight that to the public cloud service provider’s environment, once a TAG is created, it will not automatically be linked to any resource (or services resulting from the resource existence). The user must first create the Tag(s) and then manually link the Tag(s) to the desired resource(s).
Because it is a manual process and performed by a user at the cloud service provider console, the Tags resources can be time consuming for the public cloud Cost Administrator. There may be too many rows in the billing/bucket file for the Cost Administrator to check. This verification and the Tags linking process is continuous and manual.
Importante
The fact that the Tags are accessible to many services in cloud providers, it’s important to avoid adding private or confidential data to the Virtual Tags, as for example: personal identification, confidential or sensitive information.
The uCloud platform synchronizes and receives the content of the billing file (CSV) from the public cloud service provider and, consequently, receives all the Tags existing in the provider.
uCloud’s platform Virtual Tags
We mentioned above that the process of linking a Tags to a resource is manual, time consuming and, above all, it is not automatically repeated for new services of a resource that already has a linked Tag.
The new uCloud platform Virtual Tags functionality creates an automation for the Tags linking process to existing resources in the public cloud service provider’s environment. The uCloud platform Virtual TAG process may automatically link a specific Tag to a resource to be selected based on Product Name and/or Product Family and/or Resource Identifier.
It is worth mentioning that the conjunction “and/or” shows the high granularity degree the user can select to attend to their specific use of their need.
In the sequence below it is shown how the new Virtual Tags implementation allows to automate the Tags link in resources.

Nota
The picture above is an example and the present information is merely illustrative.
In the example above, every time the uCloud platform performs the billing/bucket CSV file synchronization, the Tags will be automatically linked to all resource records (rows) in the billing file in which the Product Name or Product Family or Resource Identifier correlation is found.
The Virtual Tags are applied in cloud resources (for example: virtual machines, databases) so it’s possible to create classification by projects, divisions by cost center, among other types of groupings.
These keys and Tag values may or may not be reflected in the billing reports available to consultation only through the public cloud provider’s console.
Thus, the resources imported from the bucket/billing file existing in the public cloud providers that by any policy these providers fail to index the tag to the cloud service resource, may receive a “Virtual Tag”.
But it’s very important to highlight that these “Virtual Tags” only exist in the uCloud platform database, not being written (or synchronized) to the bucket/billing that exists in the public cloud service provider’s environment.
This is a unique service and it’s available with the new uCloud platform implementation to facilitate the used resource classification in the several clouds through the “Virtual Tag”.
The Virtual Tag must be applied by the user client within the uCloud portal, in order to enable the resource automated identification that is no longer tagged by the several cloud providers with different rules and internal policies of each one of them.
After the Virtual Tag application as a uCloud platform resource and then, applying through the virtual-tag-applier Accountant, and their normalization, using the virtual-tag-normalizer Accountant.
Therefore, the information visualization will be easier for the decision making, recorded in the financial reports, regarding the used resources provided by the several clouds that were not previously tagged by the cloud itself.
The organizations that use the automated processes to manage the infrastructure include the additional Tags specific for automation, in general they create relevant grouping to organize the resources in technical, commercial and security dimensions.
Normalizing Virtual Tags
It’s important to mention the continuous existence of a cloud service provider resource, it generates new services or products resulting from the public cloud service provider resource existence/maintenance (ex.: snapshots).
When a client requests a creation of a backup copy of the new disk image (snapshot) a new snapshot may, not necessarily, receive the link of a Tag in the Virtual Tags process.
To cover this gap there is a new Tags Normalization functionality.
This process performs a comparison of each row of the billing file and when it finds a resource with no Virtual Tag but this row is a new service/product of a resource with a Virtual Tag, this process MAKES A COPY of the Virtual Tag from the main resource even if its ProductName, ProductFamily, Resource Identifier combination were not able to link the Virtual Tag.

Nota
The table above is an example and the present information is merely illustrative.
This process may take a while, because it is performed with the string comparison of characters of each billing row individually.
With this process, the uCloud platform complements the new Virtual Tags functionality, but it must be executed only when the Cost Administrator user identifies that there are resources with no Virtual Tags.
When to use
Based on this new implementation, aimed at classifying, normalization and visualization of obtained information from the public cloud several providers, the new functionality “Virtual Tags” enables to bill/tag, that is, mark the resources that by some rule or definition, were not possible to find registered in the billing of a certain cloud provider used by the organization or user customer.
Once each cloud presents different reports of used resources, the difficulty for the IT professional to be able to normalize the suppressed information by absence of Tags and understand the presented classification in several clouds, is a difficulty to be transposed.
Classify and group computing resources generated precious and valuable information, whether they are quantitative, qualitative or financial, besides facilitating the organization and/or its user customer the possibility of assertive decision making, when using this new implementation called “Virtual Tags”. Developed by the Ustore as a solution to attend this absence, it claimed in the reports that it has a similar behavior in the several cloud providers, such as AWS, Azure, Google, among others.
The uCloud portal generates the financial report, this report retrieves information by product name or by Tag. It’s the uCloud portal that offers this unique service of “Virtual Tags” that enables and/or facilitates the management and the classification of certain resources that no longer receive Tags in the cloud, as mentioned previously, by rules or internal policies established by the providers themselves.
It is necessary to use this new implementation, when the organization and the user customer need to retrieve information by Tag or product name in a distinct way, in several clouds, once each cloud provider, like Google, AWS and Azure treat the billing record report differently. And each one of them uses its own nomenclatures for each type of offered resource.
By applying the “Virtual Tags” to the cloud resources (e.g: database and virtual machines) it is possible to create classification by cost centers divisions, projects and other types of groupings.
The new implementation from the uCloud portal enables users to present the information generated in the financial report according to what was classified or tagged by the user to group or identify information, whether it is by product name, purpose, property, criteria or location, among others.
Nota
The keys and Tags values may or may not be reflected in the billing report of several clouds. The Tags don’t save semantic meaning in the Amazon EC2, they are interpreted as a character sequence.
Thus, resources imported from the public cloud billing file that, by any policies of these providers, fail to index the tag to the cloud service resource, may receive a “Virtual Tag” within the portal.
How to use
This new implementation allows to tag the missing marking resources in the cloud ticketing, either by rule or definition. This results in relevant information gained from those resources that would no longer be categorized and retrieved.
There are some common marking strategies that help identify and manage resources in the cloud, to organize resources and to allocate costs, beyond several marking categories in the cloud, AWS for example:
Techniques
Automation
Commercials
Safety
The additional Tags present better efficiency by creating groupings, Tags techniques, Tags for automation, commercial Tags, safety Tags. We can mention some among them: Name, Applicative ID, Applicative Function, Cluster, Environment, Version, Date/Time, Accept/Refuse/ Safety, Project. Owner, Cost Center/ Business Unit, Customer, Confidentiality and Conformity.
Nota
The Tag behavior in the AWS cloud: the Tags created by the system that start with aws: are reserved for the AWS use, it’s not possible to edit or exclude a Tag that starts with the aws prefix. Regarding the creation Tag limit, each resource can have a maximum of 50 Tags created by the user.
We can summarize the Virtual Tags functionality use process in two distinct moments:
Creation and Automation in the Virtual Tags use;
a. Provision an identification name for a single Virtual Tags profile with all the Tags links based on the Product Name and/or Product Family and/or Resource Identifier combination.
b. Virtual Tags Link Profile to the cloud identifier (account provider).
c. Perform Billing/Bucket file processing and synchronization.
d. Visualization of Financial reports on the uCloud platform using totalization by Tags.
e. If its identified that there are still resources with no Tags remember that:
There are resources the public cloud service provider does not link to any Tag
or that
The Product Name, Product Family, Resource Identifier combination was not enough to associate the totality of rows of the billing file.
f. The uCloud platform allows to address the Tags absence with the next process.
Virtual TAGs normalization;
a. This process should only be applied when the existing combination in the Virtual Tags Profile cannot apply Tags to all the resources.
b. This process must be executed only once a month as it demands a certain time to complete the normalization of all the billing rows in the current month period.
Atenção
This process must be started manually and normalizes the virtual Tags just for a single period, it’s not recurring or automatic.
The picture below presents the new implementation in the uCloud portal:

With the addition of the new functionality in the portal and the possibility to use the Virtual Tags to retrieve information previously tagged from the used resource in any cloud provider, uniquely, where the use can occur in two flows, detailed next:
Linking a Tag to a cloud resource through the specification of a character sequence that identifies a [ProductName], [ProductFamily] and/or [Cloud Identifier].
a. For this flow, the user can specify, for example, that the resource belonging to the:
[ProductName] Amazon Elastic Compute Cloud
[ProductFamily] Data Transfer
[Cloud identifier] i-0e85640d78d096974
Thus, every resource that has the characteristics of the example above, editing and specifying in the Edit virtual tag profile form illustrated below with the Key and Value, even if the tag is not provided by the cloud, this resource belongs to a virtual tag determined in the uCloud platform, configured in the Virtual Tags functionality


b. Link the Virtual Tags Profile created, to the cloud (account provider) provisioned on the uCloud platform.

Normalization of Tags for resources where Tags are not returned by the cloud in the product family.
a. For this flow, it will be possible to enable that in the act of the cloud ticketing data collection, the obtained resources do not come by default with the cloud provider Tag, they will be normalized with the Tags that are associated with this resource.
If there already is a Tag with the same key on the other side, the Tag will not be overwritten.
All the hyper Identifiers that belong to the same [productName].
When exporting the billing report, the “Virtual Tags” return to normal, according to the resources used in the Tags.

The picture above presents the Virtual Tags application, by the virtual-tag-applier Accountant, and its normalization, using the virtual-tag-normalizer Accountant.
Concluding, the Virtual Tag is a tag with a key and value attributed to the cloud computing resource, it helps the search, organization, management and filtering of resources used from any cloud provider, for example: AWS, Azure, Google among other providers. After the Tags are created they can be classified by purpose, property, criteria or location.
Importante
By the fact that the Tags are accessible to many services in the cloud providers, it is important to avoid adding private or confidential data to the Virtual Tags, as for example: personal identification, confidential or classified information.
The uCloud platform synchronizes and receives the billing content file in the .csv format, proveninent from the public cloud service provider and, consequently, receives all the Tags existing in the provider.
Invoice Credit Management Report
The Invoice Credit Management Report, denominated briefly as ICMR, is a utility report from the uCloud Billing Menu.
Nota
Report exclusive for the system administrator.
It has the objective to allow for the system administrator to make the individual control of which credits the client receives, at the same time views the total of credits on the cloud and the total received by the client.
By adding the credit to the user’s invoice, it is passed on to the client. However, by not adding it, the credit does not go into the invoice, consequently the client does not receive this value.
It is possible to follow how much of the credit stays for the client in real time, the informative board with the total credits on the portal is immediately updated after making any of the actions mentioned above.
Accessing
To have access to this functionality, the user must select the Billing menu, located on the side menu, as shown below.
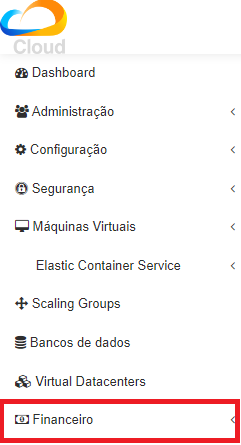
When selecting it, the “Reports” and “Utilities” submenus are presented, the user must click on the “Utilities” option.
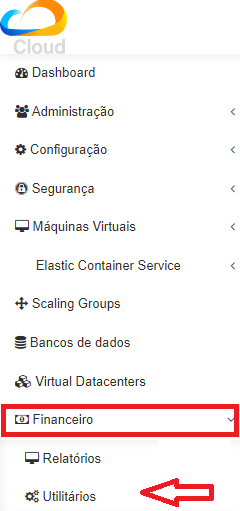
Next, the screen of the billing utilities panels is shown, it presents six reports.
Dimension
Virtual Tags
Accounts Survey
Invoice Credit Management
PMC integration with Odin;
Costs Centers.
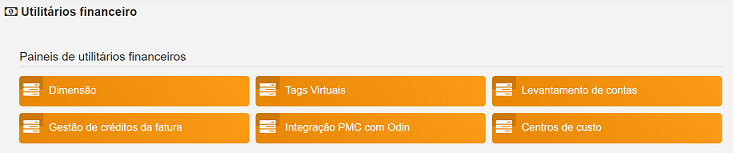
To have access to the ICMR, it is necessary to click on the “Invoice Credit Management”, as evidenced on the following image.
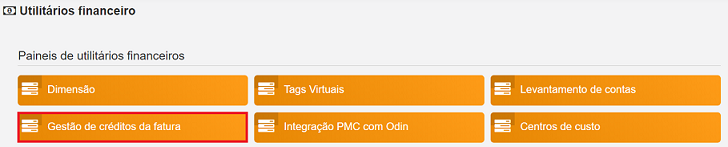
After selecting this option, the initial screen of the ICMR is displayed, allowing for credit management.
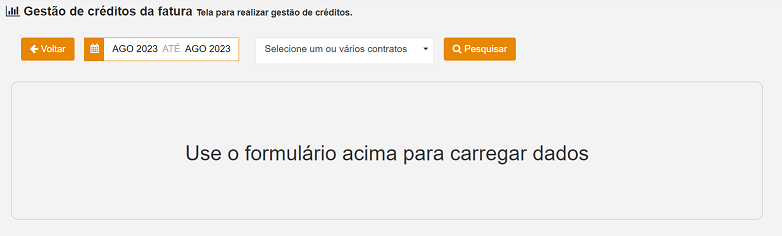
In the image above it is possible to view the following functions:
Backbutton: the user can return to the previous screen at any moment;Period: indicates the calendar for the needed choice;
Company: presents a list with all the existing companies;
Searchbutton: recovers the result of a search.
Creating
With the objective of generating an ICMR, it is necessary to select the desired period. Clicking on this option, a calendar is shown.
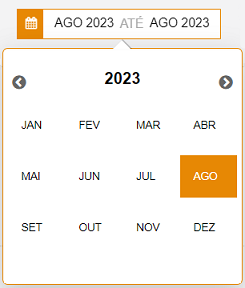
The calendar displays year and months, on which the user can choose the desired period according to the necessity.
The next blank presents a list of the dropdown type, in it it is possible to select one or more companies clicking on the intended checkbox.
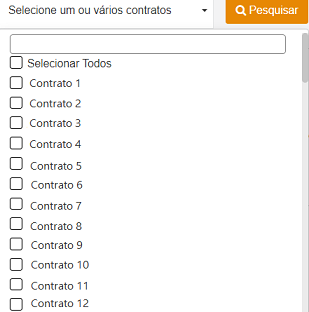
Finishing this step, it is necessary to press the Search button for the credits related to the information selected by the user are presented.
Detailing
After the screen is updated, the data of total credits on the portal and total credits in the cloud are loaded:

Thus, it is possible to compare the value of the total of credits passed for the client and the credits present in the cloud.
The result regarding to the period searched is listed next, as shown in the figure below:


This list contains eight columns and two action buttons, besides the lines block, each one is described next:
Company;
Account provider;
Consumption period;
Billing month;
Detail;
Type of resource in the cloud;
Cost;
Active in the invoice: operationalizes the management by acting it or not.
Importante
To insert a registry with more ease, it is possible to filter the information in the columns of company, account provider, billing month, detail and type of resource in the cloud. This action is allowed through the text box right below the column name.

It is possible to choose the type of viewing of the list from the information block of 10, 25, 50 or 100 rows, located on the inferior part of the card.
Nota
In the example above, only one company was selected, therefore, only the information regarding this company is presented. The user could choose more than one and view them the same way.
The credits edition also allows to order the information in ascending or descending, for that is necessary to click on the names of the following columns:
Company;
Account provider;
Billing month;
Detail;
Type of resource in the cloud;
Cost;
Active in the invoice.
Editing
The edition of this report occurs through the column “Active in the invoice”, where it is possible to repass or remove an added credit by clicking, or not, on the checkbox.
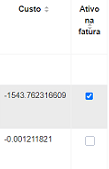
When enabled, this credit is added to the user’s invoice, therefore, repassing for the client. However, if not enabling this option, the credit does not go into the invoice, consequently the client does not receive this value.
After making any of these actions, it is possible to follow the client’s credit in real time, once that informative board of total credits in the portal is updated immediately.
Thus, this report has as finality to allow the system administrator to make the individual control of what credits the clients receives, at the same time as they view the total of credits in the cloud and the total received by the client.
To conclude this edition, the user just needs to click on one of the action icons described below:

The “Cancel alterations” icon  , represented by the red-colored button.
In case the user gives up of the registries, it is possible to restart the alterations with no need to change the screen clicking on the icon . Then, an alert message is displayed on the screen for the user to confirm the action.
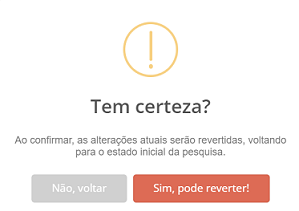
If the user wants to give up on the operation, click on the No, return. The same way, if the user wants to confirm the reversion of this alteration, just click on the button Yes, revert, the credits return to the initial form of when the search was made.
After this, a message is shown on the superior right corner of the screen, however, it is not presented on the Tasks menu.

“Save alterations” icon  , indicated by the blue-colored button.
To confirm the desire of making the edition of the credits made available to the client, it is necessary to click on the icon . Then, an informative message is presentes, the moment that the user can follow the update progress of the altered register.
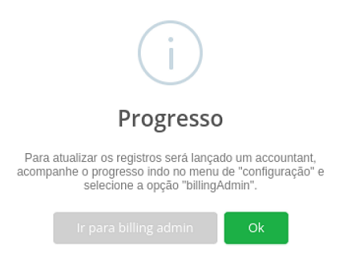
When this informative message is viewed by the user, they can confirm the registry update by clicking on the Ok button and , if they want to follow the progress, click on the Go to billing admin button.
Importante
By adding or removing any credit from the company it is essential to bill it again for the values to be updated in the invoice.