
User manual
Information technology solutions that make it possible to implement a scalable, solid and reliable computing architecture in a hybrid cloud.
Introduction
This document aims to introduce the main characteristics and functionalities regarding the uSavings application.
In this Manual are introduced concepts, screens, functionalities and commands for this product usage.
Vision and positioning
This document describes the uSavings application, the vision and the product positioning. It’s important to clarify that it is found in constant development and evolution, because of that, the screens shown in this document can suffer alterations at any moment, due to the software evolution.
The present trend, increasingly stronger, from computational resources migration of private clouds or co-location environment, to the provider’s environment in public cloud, represents one of the greatest challenge of organizations that is the Cost Governance originated from the great use of those computational resources and, consequently, the companies cannot obtain the due visualization of those costs in the future.
Nowadays, almost the entirety of the Cloud Service Broker (CSB) platforms can present cost reduction suggestions, however, obtaining some values is dependent on a human service (or action).
The public cloud’s service providers, continually and uninterruptedly, make new hardware configurations (flavors) available with similar characteristics, but the values, sometimes, are very different. At this point, it is up to the architecture specialist to search for possible and compatible hardware configurations.
The uSavings Platform completes these activities automatically so that the hardware comparison configurations and/or recurring costs can be presented clearly to the user of this platform.
The uSavings Platform, obtains the inventory of all the public cloud computational resources through its integration with the uCloud Platform. Therefore, the list of servers computational resources presented in the uSavings Platform interface is the faithful representation of your environment found in the public cloud service provider, thus, the existing reality in its environment.
All the alternative options of hardware configurations are informed as suggestions, as it is up to the user to change (reconfigure) the hardware of the computational resource (flavor) at the best time for their environment.
It’s important to highlight that the uSaving Platform only presents suggestions, since any change of hardware configuration (flavor) can only be effectuated with the infrastructure turned off (cold), that way, the user must manage the best moment (day and time) to act in this configuration change.
The integration with the uCloud Platform allows the user to visualize the suggestions presented in the uSavings Platform interface, so it is possible to correctly identify the computational resource, and, through the uCloud Platform, execute the task of changing hardware configuration (flavor) directly in the public cloud provider’s environment, without the need for the user to be logged into the public cloud provider’s console.
What is uSavings?
uSavings is a tool that analyzes the computational resources infrastructure consumption in real time (of Virtual Machines - VMs) in different clouds, it is through this analysis that the application recommends modifications. In case the organization accepts or supports this suggestion, such a decision can generate the maximum financial economy and optimization of resources created and/or executed. The application uSavings is a cost advisor, that is, a cost consultant that allows to advise the user how to reduce the costs of its infrastructure, ticketed through uCloud Platform, in the multiple cloud services providers - AWS, Azure, Google, IBM and VMWare.
How does it work?
The uSavings Platform, besides obtaining data from several clouds, extracts information from the historical data of the Virtual Machine itself and from the ticketing of each public cloud provider - this data gathering is started by the integration with the uCloud Platform. The application presents a consolidated panel and customer spending suggestions in each cloud provider, therefore, delivering precise information for the best decision making on the allocated costs of organization’s infrastructure resources.
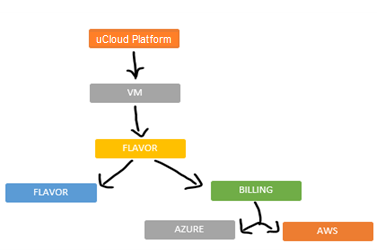
The figure above represents the uSavings organizational chart: there, the uCloud Virtual Machine, is one of the main elements in this flow, according to the diagram above.
The following element is introduced as Flavor, it makes it possible to know how much memory, vCPU and other resources are used by the machine.
Therefore, according to Flavor we know how much a certain machine costs at the end of the month. With this data, it is possible for the uSavings Platform to suggest the customer resources economy to the monthly invoice.
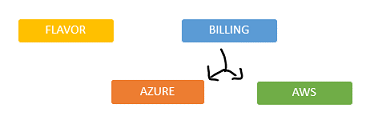
The cutout in the organogram, highlights the relevant part of the diagram, it represents the uSavings application’s suggestive form. There are two ways to recommend improvements to certain Virtual Machines: (i) by Flavor and (ii) by Billing.
By Flavor - The uSavings checks the allocated Flavor in the machine, and suggests an upgrade possibility - this improvement is related to cost benefit - the application publishes the results in several formats (graphs or percentage) and it shows which is the best cloud to be used to save resources, for the VM. This parameter, by deduction, understands that the machine is on all the time.
By Billing - The ticketing from the uCloud database supports several clouds, it differs from the scope of uSavings application. The uCloud database can support all types of billing available. In the uSavings business rule, though, it’s only possible to make an assertive suggestion with the billing for AWS and AZURE, as shown in the diagram, in the figure cutout of the organizational chart, shown above this paragraph.
How to save resources?
The advantage of implementing uSavings in the organizations is the possibility of receiving information about idle resources that were created, and even, previously executed, currently not used. Information that can make it possible to save resources.
The fact that the uSavings application is a tool that analyzes the computational resources infrastructure consumption in real time in different clouds, the uSavings application shows the idle resources created.
The tool is relevant for decision making in organizations, because when analyzing the information obtained by the application, it delivers real results. This contributes to an organizational decision capable of generating the financial economy and optimization of resources created and/or executed.
The uSavings application can reference to configuration reduction suggestions - rightsizing of virtual machines, in case they were previously created with “super configurations” and/or present a low consumption in the performance history. It directs the possibility of increasing the cost-consumption ratio, does not execute it. The uSavings Platform implementation objective is to indicate to the organization the possibility and/or the path to increase its cost savings, in the next charge period of the cloud service provider.
Atenção
The information equipped organization, delivered by the uSavings application, must be in touch with the service cloud provider about “rightsizing”.
By acquiring the uSavings Platform, the organizations can have in hands a valuable strategic and Business Intelligence (BI) tool that indicates the best way to enlarge the relation cost-benefit of its virtual infrastructures and, also, the best way to maximize the resources of virtual machines created in the service cloud providers.
Optimizations recommended after monitoring
The following four optimizations can be proposed, based on suggestions of:
Rightsizing:
It consists of suggesting the best combination of CPU and memory, with the objective to minimize the costs and maximize the performance. The tool collects performance metrics to determine the average and maximum resources consumption of an instance in a chosen time period and recommends a modification for a configuration of a virtual machine «VM» of less composition or appropriate for the project.
Comparative Costs:
It presents to the user the current relation of its Virtual Machines «VMs» and a suggestion of what would be the “best configuration” in each cloud provider. It allows the user to evaluate which provider is with the lowest cost in a certain Virtual Machine, on the date that the value of this cost was obtained.
Monitoring Idle Resources:
The monitoring of idle resources allows to check if the resources are in use. It is possible to monitor the created and unused resources.
Reserved Instances:
Regarding the reserved instance, the uSavings application can show the user-customer that in case of alteration from an on demand machine to a reserved machine - the reserved instance can show how much is possible to save in relation to the current machine.
For example:
When using the AWS provider, the Amazon EC2 Reserved Instances (RIs) are one of the most obvious ways to control the computation costs, allowing the user to reserve the EC2 computational capacity in exchange for significantly discounted hourly rates.
It’s important to observe and reinforce to the customer/user that the reserved instances (AWS, AZURE or a preemptive Google instance) are not instances that the user can create and run for a lower price than regular instances. And, it should be considered that there is no guarantee that these computational services are dedicated to the customer or are available and accessible 365 days of the year.
In case the cloud service provider needs to have access to these computational resources, for another type of task, the provider can terminate these instances to any moment (that is, force the interruption of these Virtual Machines) with no obligation of prior communication.
Home Menu
The initial interface presented to the user is a dashboard which displays a summary of the current infrastructure, addressable and accessible through the uCloud Platform. Upon accessing the uSavings interface, the user automatically connects with their Virtual Machines’ current infrastructure.
This way, the user visualizes the current costs of existing Virtual Machines, comparing the costs of their Virtual Machines between the various providers of public cloud infrastructure services.
The uSavings allows users to create manually a list of VMs with specific configurations (a private and/or “imaginary” configuration), in case the user wishes to obtain the complete list of their Virtual Machines and prefers to connect in a manual form.
How to access the uSavings Platform
The access to the uSavings Platform is through the web, it can be used in any of the browsers: Firefox, Google Chrome or Microsoft Edge, on several operational systems, such as Microsoft Windows 10 or 11.
Atenção
It is important to highlight that the uCloud Platform is not compatible with Microsoft Internet Explorer (IE) in any version, as the technologies of this browser are outdated and do not support the evolution of current HTML pages.
For the initial access it is necessary to request the administrator for the credentials - when receiving the link with the address and access credentials, the user must use their preferred browser to access the web and connect. Another way of access to the uSavings Platform is directly from the uCloud Platform, through its left side menu.
If the access is made directly through the web, the picture below is shown to the user. At this point, they must enter the given credentials.
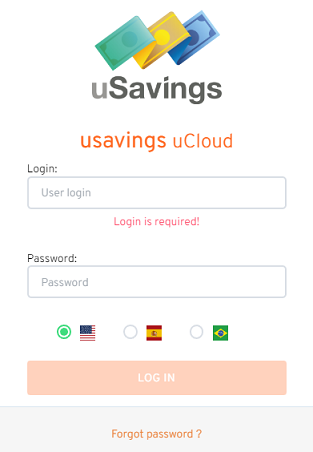
The user must fill in the login and password blanks, with the credentials received from the platform administrator. Click on Log in. After this procedure, the initial dashboard screen is displayed.
If the dashboard screen is not displayed, it means that some of the blanks are filled with inconsistent information, that is, inexistent login or password and/or there may have been an error while typing the information. It is important to check and repeat the operation.
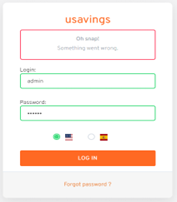
In case of failure to log in, the picture above is shown to the user with the following orientation: (i) check the credentials and (ii) repeat the operation.
General View
Initially, before entering the dashboard session it is important to understand the impact of some existing tools in the superior menu.

For this, the superior menu cut is shown in the figure above, it displays relevant components, described in detail below, in the order: from left to right.
Exchange Contract Icon
This icon  is an important topic to highlight, based on the premise that there is a possibility that a user registered on the uCloud platform is part of more than one group of users. Therefore, they can be part of more than one contract. And, there is a possibility to select another contract, this selected contract can contain other resources tied to this contract.
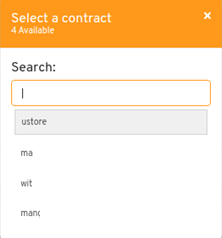
This contract exchange icon shows all the contracts in which the user logged into the uSavings platform participates. Therefore, the user can switch between them freely. The exchange of contract may imply in the exchange of resources which are presented to the user, as each contract can have a particular characteristic, in the sequence of this uSavings’ user manual these details are described.
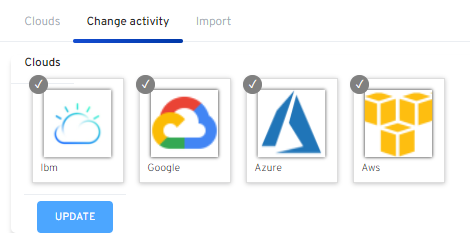
Clouds Configuration Icon
As an introduction about usability of this screen cut: 
It can be said that the term “Clouds” is used to abstract a group of Flavors from a given Cloud, this grouping being as real as imaginary Flavors.
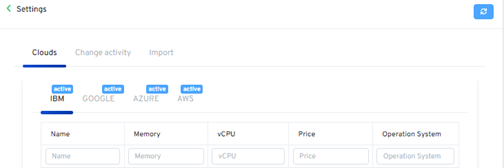
In the settings menu there is the part of Clouds creation, changing the activity of the Clouds and area of creating new Clouds.
Language Switch List Icon
This icon  allows to change the language on the uSavings Platform, the platform is originally in Portuguese and can be switched to Spanish and English, just click on the icon with the flags:
Logged User’s Name Icon
This icon  shows the user’s name and who is logged into the uSavings Platform.
Logout Icon
This icon  logs out the user from the platform.
Panel Control - Dashboard
The initial uSavings interface displayed to the user is a panel control (dashboard).
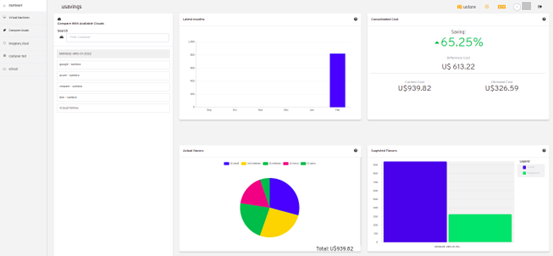
This panel, image presented above, displays some data on the screen that portrays a summary of the current infrastructure addressable and accessible through the platform, these data are composed of segmentation called Cards.
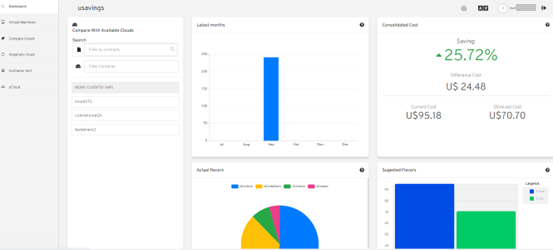
In the first part of the home screen, shown in the image above, only the cloud service that the organization has in the uCloud Platform and authorizes the integration are mirrored, the access being through the uSavings Application.
In this case, the picture of the container connected to the uCloud Platform shows a list of the containers that participate in the contract in which the user is connected. This access authorization works through the Contract, as the example below:
Nota
When a certain uCloud Platform container is contained in the Virtual Datacenter, which in turn is part of a contract in which the user logged into the uSavings platform is part of.
That way, there is access to the container data, only after this access and data analysis can the uSavings Platform suggest upgrades of use performance.
The dashboard allows the quick visualization of each of the clouds connected to uCloud, which are reflected in the uSavings application. In case the user’s cloud is absent from the uSavings, it means that the cloud was not connected to the uCloud Platform.
Next, in this document, the four cards displayed on the dashboard screen are described in detail.
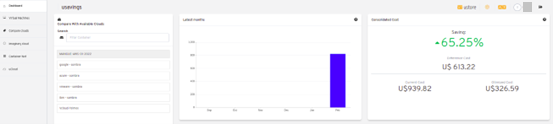
Latest Months
The first card, Latest Months, presents the ticketing that occurred in the period related to the last six (6) months, that is, all the values invested in a certain account, for a period related to the last 6 months, are listed.
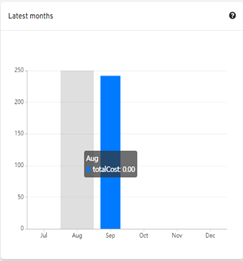
Said amount is collected through values generated by the uSavings job, responsible for summarizing the billing of the uCloud platform.
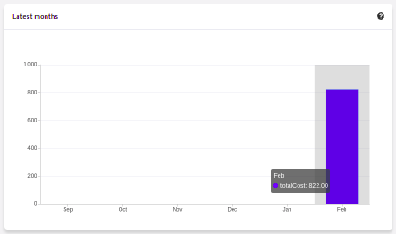
The graph in the picture above presents the cost value in dollars versus the required period of the last 6 months.
Consolidated Cost
The second card, Consolidated Cost, displays some suggestions on the Dashboard screen, these suggestions are related to what the selected Virtual Machine contains, it’s relevant to mention that all the values are presented in dollars. The card shows the Flavor and the regions enabled for the machine, the gathering of this information allows suggesting improvements to optimize the use.
In this card are detailed information regarding the saving percentage, cost difference, current cost spent, optimized cost and Flavors used e/or suggested by the application. Values presented in dollars.

In the image above, it can be seen that the 65,25% percentage in the Saving area represents the percentages of savings the uSavings application delivers as result, based on the Flavor change suggestion within the cloud itself. That is, the user is conducting a search in the AWS cloud, the displayed savings of 65.25% can be implemented when switching Flavor within the cloud itself.
The detailed information, in this consolidated cost card, present a wealth of details for understanding between the best combination of CPU, memory and disk, with a focus in the cost reduction:
Saving - Shows the savings percentage (in green) or spent (in red) based on current consumption and compares with the suggested optimization;
Difference Cost - Represents the same calculation used by Saving, revealing the difference in Real (R$);
Current Cost - Presents the amount being spent, referring to the period in which the analyzes was collected;
Optimized Cost - Indicates the future value, in case the suggested changes are accepted and implemented.
Obs: All the shown values may change over the period, depending on the consumption transmitted in the clouds.
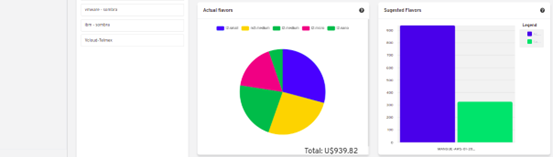
Actual Flavor
This third card presents this container’s selected machines’ Flavor, if it is modified, it carries new information. The display of the percentage used by Flavor is presented by the pie chart and its representativeness occurs by type, in the total set of the infrastructure.
All the values are displayed in US dollars, with no taxes. The prices have come from the table imported directly from the cloud provider and inserted in the database of this application. The price is calculated according to the quantity of hours that comprise the month.
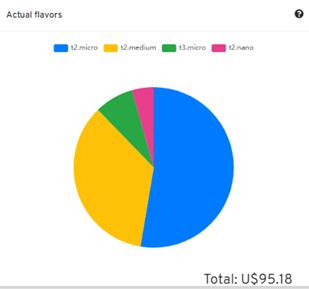
The information contained in the picture above refers to the AWS environment, where each item differs in terms of memory size, vCPU, price and operational system and, by the end, it is presented the total cost value of Flavors used currently.
Suggested Flavors
This card presents another type of graph, from the Actual Flavors card it demonstrates how much would be the difference from the referenced economy suggestion. That is, how much is possible to save the created resource that is idle, when presenting the current consumption information and the consumption suggestion in a bar graph.
The blue bar represents the current consumption, the green bar suggests the economy that can be generated, in case of application of the suggestion for the improvement in consumption of resources presented by the uSavings Platform.
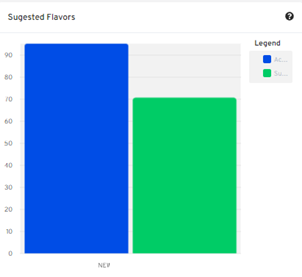
The graphs and information presented are a potential value economy initial analysis that the organization can benefit from adopting the recommendations suggested by the uSavings Platform.
The values presented refer to the period of data collection (the minimal initial gap is fifteen days). The longer the time of information collected, the more reliable the estimated calculated economy is.
This initial analysis is calculated based on the usage, that is, the occupation of the computing resources of the virtual machines within the period stored in the uSavings platform database.
The result of this analysis is the suggestion of the best combination of CPU and memory. Suggestion aimed at reducing costs and maximizing performance (rightsizing). The analysis does not make the comparative calculation between the Virtual Machines’ configuration values in other providers.
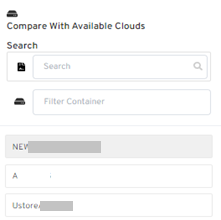
Functionalities Menu
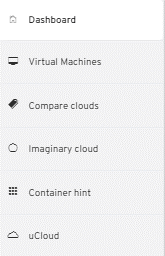
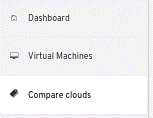
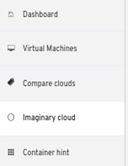
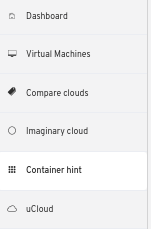
On the left side of the uSavings platform input menu, the functionality menus are listed, they are: Virtual Machines, Compare Clouds, Imaginary Cloud, Container Hint and the uCloud platform access menu.
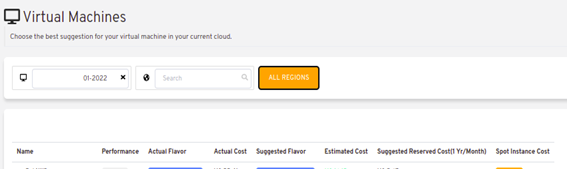
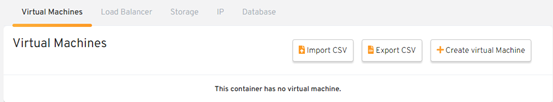
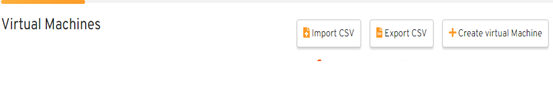
Virtual Machines
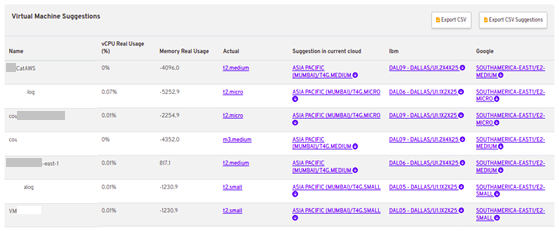
The Virtual Machines menu displays all virtual machines in the user’s infrastructure (i.e. the inventory of all virtual machines of the accounts belonging to the organization).
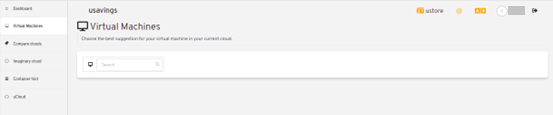
This exhibition allows the selection of the specific container for cost analysis and flavor change suggestion in the same cloud as the listed virtual machines. All information presented below can be exported in a report in a .csv file.
It is relevant to highlight that the pointed container must be contained in the uCloud, that is, the container to be analyzed must be connected and synchronized on the uCloud Platform.

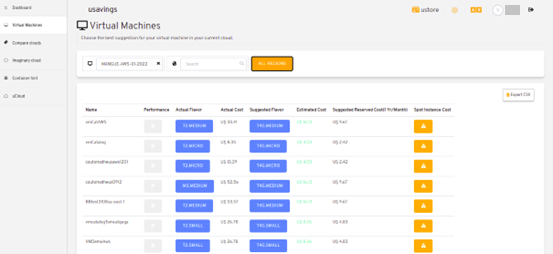
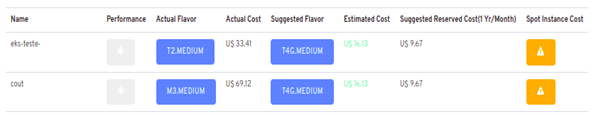
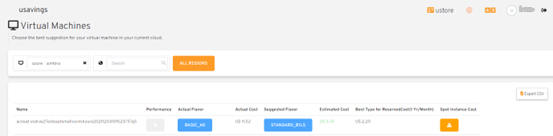
After selecting the container, the information presented in columns, following the order from 1st to 6th column:
The name of the virtual machine;
The flavor used;
The current cost of the machine is assigned if it is for the entire month;
The suggested flavor for the optimization;
The monthly cost of the suggested flavor;
The annual value of the virtual machine.
The displayed suggestions (Rightsizing) are based on the CPU consumption of the virtual machines, from the time it was created until the present moment. The metrics are collected and the calculation is based on the consumption averages, then the suggestion is presented.
The memory consumption analysis can be part of the calculation, if the provider or the instances are ready to provide the necessary metrics. In case the information is not available, the memory defined by the flavor of the deployed instance is assumed.
Rightsizing - Flavor change suggestion
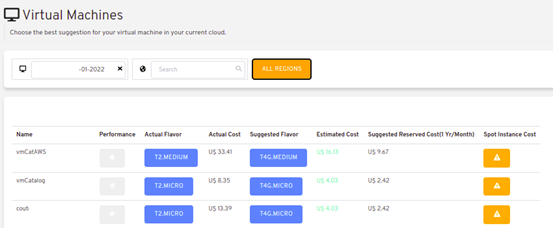
To receive the result of the Flavor change suggestion, the user must select the desired container, according to the picture presented below. The uSavings Application generates the list and the comparative prices. Just click and wait.
As a result, this operation is displayed in the picture below, which shows the several pieces of information in blocks, such as: the Flavor and the current Cost, the Flavor suggestion and the estimated cost of this new Flavor. Finally, it displays the suggested and estimated Flavor booking cost for 1 year.
Use Case
To start this use case step by step, it is relevant to remember the listed virtual machines came from the uCloud Platform, therefore, the clouds connected to the uCloud must contain the virtual machines.
In case of the inexistence of virtual machines, consult the uCloud Manual, in the topic: How to connect and import Virtual Machines.
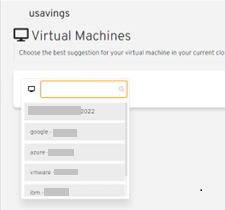
Step 1:
Select the cloud (container) you wish to analyze.
Step 2:
Choose the region that runs the selected Virtual Machine.

Step 3:
The selection result is shown according to the picture Estimated selection result positioned above the Use Case topic, which is the list of all Virtual Machines. In this same screen, in the superior right corner, it is allowed to export the result list in .csv. file. Just click on the Export .csv. button.
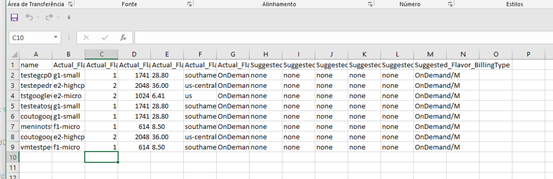
Step 4:
Export the report to visualization in excel spreadsheet, in the user’s machine. The result is similar to the Reported exported to excel presented below:
Step 5:
There is the option to analyze the performance information, in the Performance column, as it’s shown in the following picture. Right after the Name column, the Performance column presents an icon with an * (asterisk) symbol.
Step 6: By clicking on the * (asterisk) icon, the performance report is shown:
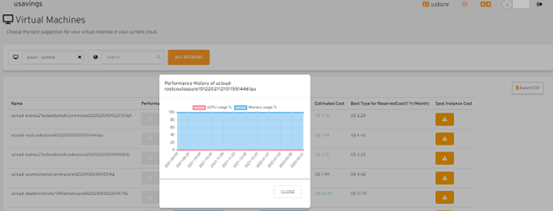
The performance report provides the graph visualization with the average consumption of CPU and memory of the selected virtual machine, in a period of approximately 15 to 20 days.
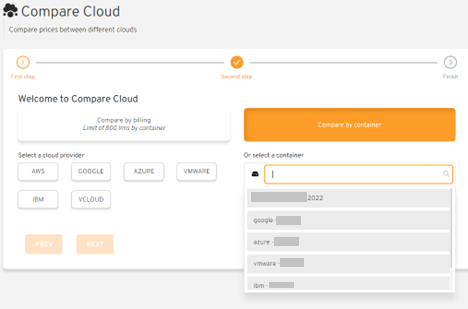
Compare Clouds
In the uSavings Application, the “Compare Clouds” functionality allows to make the comparative analysis By Billing or By Container of the costs between the used cloud and the clouds chosen to compare.
For the units to become available, it is necessary the integration with the uCloud platform, in this case, the accounts must be connected and synchronized, respecting the security rules definition
The Compare Clouds allows to make the comparative analysis between the cloud itself, as well as comparing with other clouds. As well as comparing with the public clouds that are not connected to the uCloud platform, for example: IBM, AZURE, Google, AWS.
There are two ways to perform this comparative analysis, comparing by Billing or by Container.
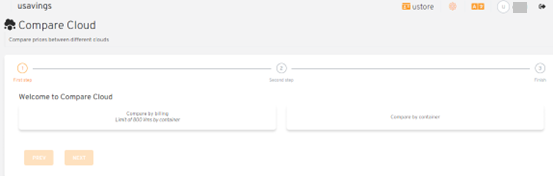
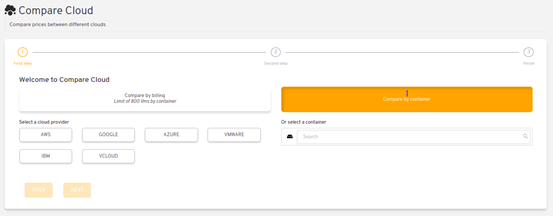
In the picture above are presented two bars with the possibility of making the comparative analysis:
Comparing by Ticketing and
Comparing by Container.
By clicking in the intended bar it takes the color orange, according to the following picture:
Reinforcing, for the units to be available, it is essential to integrate with the uCloud platform.
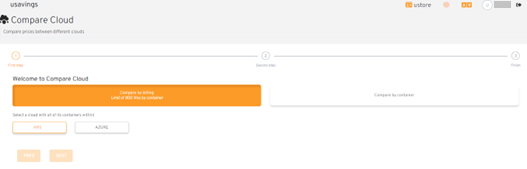
Compare by Billing
In order to make the comparative analysis by Billing (Ticketing), it is necessary the ticketing agent has been executed in the given container. Currently, we support the comparative analysis by Billing to the AWS and Azure clouds, see the picture above.
Before selecting the container or cloud to be compared, it is necessary to check if the uCloud platform is ticketed. At least one (1) container must be ticketed and connected to the uCloud platform.
Nota
Meaning of the “being ticketed” term: it is the existence of the consumption invoice in a certain period, a minimum period is at least one month.
Step by step
Step 1: To make the comparative analysis, initially, click on the Compare by Billing button. Check if the uCloud platform is ticketed, at least one container must be ticketed and connected to the platform.
Step 2:
Select the cloud containing all its containers, picture below. Click on AWS or AZURE, next click on NEXT.
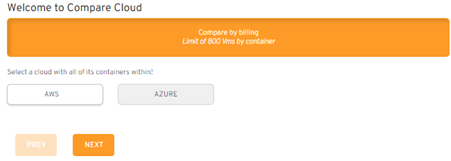
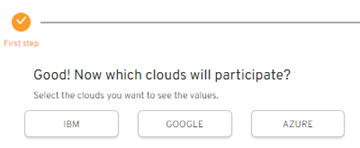
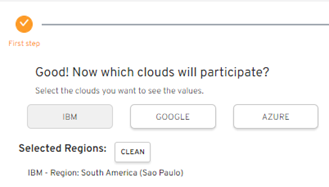
In this case, the AWS cloud is selected. By clicking NEXT, the uSavings Application presents the next screen with the question: “What clouds will participate in this comparison?” and it requests, to the user, select the clouds they wish to carry out the comparative value analysis.
Step 3: By selecting the cloud, the user must fill in the calendar with the period corresponding to the analysis.
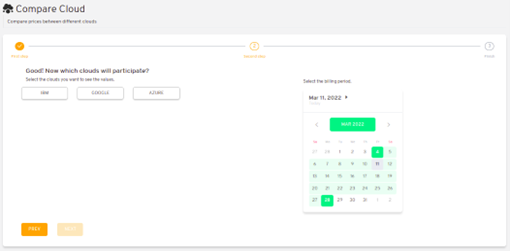
The period is important, because the cloud value can suffer alteration due to the cloud provider. For this reason it is possible to pick a determined time gap. This gap is calculated based on the Billing generated by the uCloud.
Step 4: Select the clouds that participate in the comparative value analysis. That includes the clouds the user does not have necessarily connected to the uCloud platform, such as IBM and GOOGLE clouds, as shown below:
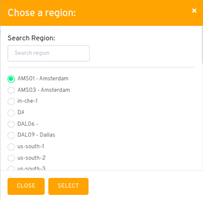
Step 5:
In this case, by selecting any of the public clouds listed, the next screen is destined to choose the region. It is important to know that this region corresponds to the registered Flavor in the database.
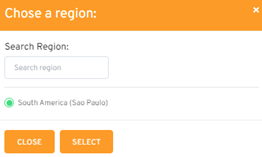
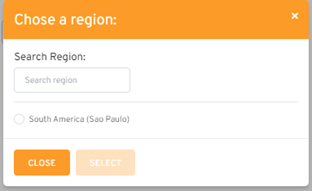
Step 6: After selecting the region by cloud, the uSavings application presents the picture Results after the region choice with the result in full for the selected region. And a button that allows the user to delete the region, for the possibility of error and choosing of another region.
To enable the comparative analysis by Billing (Ticketing), it is necessary that the ticketing agent has been executed in the given container.
Currently, we support the comparative analysis by Billing for the AWS and Azure clouds. And, for the units to become available is necessary for the integration with the uCloud platform. In this case, the accounts must be connected and synchronized, respecting the security rules definitions.
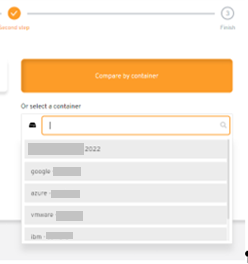
Compare by Container
The second comparison offered by the uSavings application is the analysis by Container. It’s necessary to select and advance the process sequence to obtain the intended result which is the comparative analysis by container. For the process to happen it is essential to select another cloud, besides the initial cloud already chosen.
Step by step
Step 1:
To perform the comparative analysis, initially, click on the Compare by Container button.
Step 2:
Select the container according to the figure presented below. This container is compared with the previously selected cloud, see the picture above, locate the place where all the clouds are, on the left side of the previous image.
Step 3:
Select the region and click on Next to finalize the operation and obtain the result.

The result is displayed and then the user gets to the last step.
After the comparative analysis is performed and the result is presented, this document follows with the description of the next step, when the comparative data is on screen.
Analyze and Export the collected information
The uSavings platform allows the user to browse in each one of these information units and select them according to the information necessity.
Step 4: Analysis and exportation of collected information.
The picture below presents some cards demonstrating values about suggestions in the same cloud and in the chosen clouds. The results can be viewed directly in the uSavings application, or exported to a report in .csv. format.
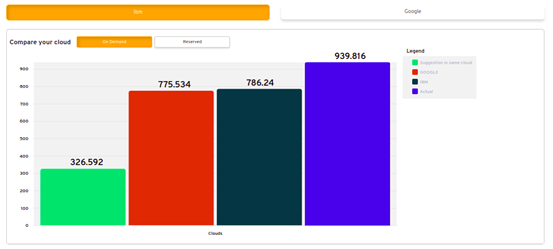
The green bar mirrors the analysis that shows the lowest value, because it represents the lowest cost, this cost is the Flavor exchange suggestion within the cloud itself. The central bars represent the estimates from other clouds, in relation to the bar to the right (blue color) which represents the current cloud with the current cost value of the contract.
Going down the screen, the second part of the comparison between Flavors versus clouds, the combination of CPU, memory and the respective cost is presented.
On this screen, it is possible to see the comparison of flavors and clouds. Also, when hovering the mouse over the different flavors, the combination of CPU, memory and their respective cost are shown. In this table is also possible to change the suggestions made by the uSavings, in case it’s not adequate to the user and organization’s use.
In the picture above, the screen result shows the detailing by each Virtual Machine and the costs per cloud, the user can hover the mouse and visualize the Flavor cost in the distinct cloud.
By clicking on this information, a menu opens that allows the user to change the Flavor suggested in the cloud.
In case of selecting another Flavor, the uSavings application asks if the user wishes to change to other similar or equal ones. In the affirmative case, all the Virtual Machines g1-small are calculated as e2-small. Consult the picture below that represents the exported report in .csv. format:
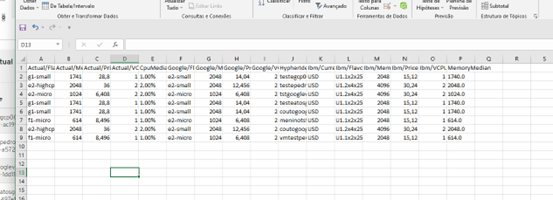
Such procedure does not change the Virtual Machines’ Flavors in the clouds, only calculates the estimative of Flavor alteration; it must be performed on the clouds console or on the uCloud platform.
Imaginary Clouds
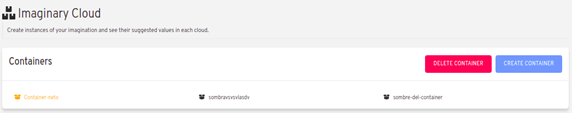
The penultimate uSavings submenu functionality is nominated Imaginary Clouds.
The Imaginary Cloud submenu allows to create an imaginary environment, intending to predict the user/customer’s infrastructure cost by using the different public clouds.
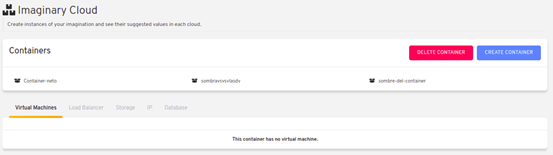
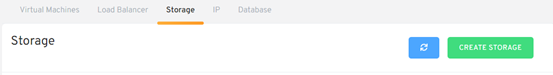
On the Imaginary Cloud home screen, the created Containers can be viewed, it’s also possible to Delete Container. As well as visualizing the Virtual Machines. Load Balancer, Storage, IP and Database. Next, the details of the screens and the description of the columns of these 5 items:
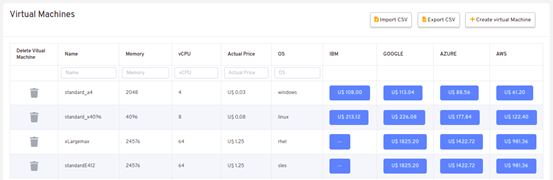
On the Imaginary Virtual Machine screen, the ten pieces of information presented from left to right:
(i) delete virtual machine;
(ii) Name;
(iii) Memory;
(iv) vCPU;
(v) Current price in dollar;
(vi) Operational System;
(vii) IBM;
(viii) Google;
(ix) Azure;
(x) AWS.
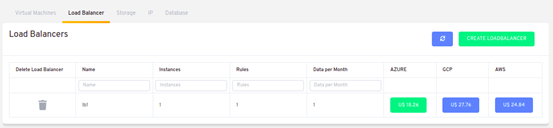
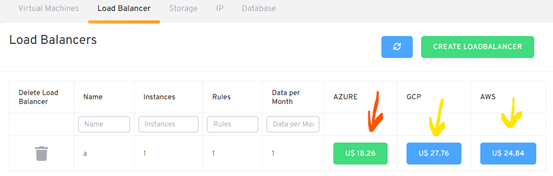
The Imaginary Load Balancers screen presents eight pieces of information on the screen, from left to right:
(i) Delete load balancer;
(ii) Name;
(iii) Instances;
(iv) Rules;
(v) Data by month;
(vi) AZURE;
(vii) GCP;
(viii) AWS.
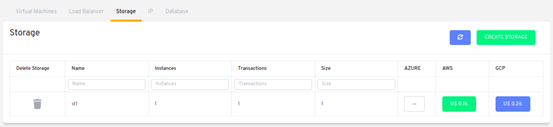
The Imaginary Storage screen displays six pieces of information on the screen, from left to right:
(i) Delete storage;
(ii) Name;
(iii) IP Quantity;
(iv) GCP;
(v) AZURE;
(vi) AWS.
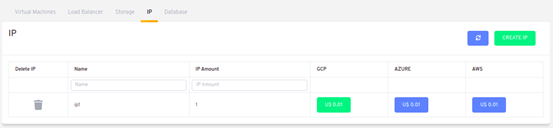
The Imaginary IP screen displays six pieces of information on the screen, from left to right:
(i) Delete IP;
(ii) Name;
(iii) IP Quantity;
(iv) GCP;
(v) AZURE;
(vi) AWS.
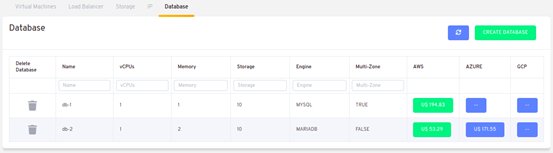
On the Imaginary Database screen, the ten pieces of information presented from left to right:
(i) Delete Database;
(ii) Name;
(iii) vCPUS;
(iv) Memory;
(v) Storage;
(vi) Database;
(vii) Multi-Zone;
(viii) AWS;
(ix) AZURE;
(x) GCP.
Through this environment the user is allowed to create an imaginary environment (container) and delete the created containers.
The Imaginary Cloud environment allows the creation of machines, import .csv. file with the infrastructure inventory, allows the creation of containers and presentation of a screen with the cost of the different clouds.
These imaginary environment screens are the result of the intention to predict the cost of the user/customer infrastructure by using the different public clouds. Each of those columns represents a cost of what would be accomplished, including the migration cost.
After all this imagination of scenarios, the application provides the documentation in a .csv file ready for importation and use in decision-making meetings.
After the creation of the imaginary container, it is possible to keep creating other resources and comparing their prices for the different clouds, also showing what would be the cloud that provides the lowest price for the desired data.
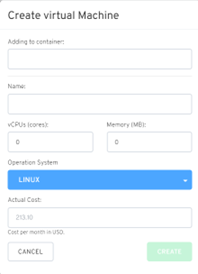
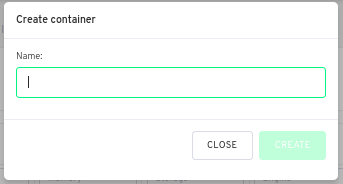
Starting with the Virtual Machine creation, we have a series of inputs that must be filled in, starting by the Name blank to the other options such as vCPU, memory and desired operational system, beyond that, it must stipulate how much the budget there would be to “pay” for this Virtual Machine.
After its creation, the results are presented on the screen, in two formats: * (i) the graphs relating the virtual machines with the desired Flavors for each of the clouds that the product covers; * (ii) in a .csv table that can be exported for the user’s need for information other than those presented in the graph, in case the graph is not sufficient or satisfactory.
The application has an option to create an imaginary Load Balancer in the same way, with 4 inputs this creation also needs a name - The Name input is required for all creation options - and 3 new inputs.
Instances,
Transfer rules and
Data per month in GB.
The results are presented in a table format, which shows the desired service’s prices for each Cloud. It is worth mentioning that in this creation example of Load Balancer, the AZURE cloud presents the lowest value, secondly is the AWS cloud and, finally, the higher cost in this example is the GCP cloud. This is how the uSavings application suggests the economy of contracted resources for decision making in the organization.
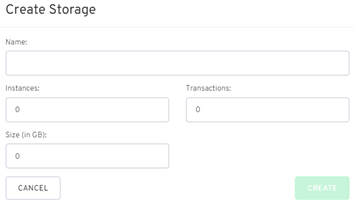
Following the process, creating an imaginary Storage in the same way, with 4 inputs that consist of the inputs:
Name,
Instances
Transfer quantity and
Size in GB.
After creating a Storage, the presentation screen is similar to the Load Balancer display.
For the penultimate creation option we have the IP, that follows the same logic, requiring only 2 inputs:
Name and
IP quantity.
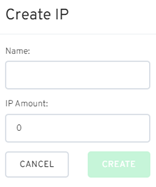
The IP screen presentation format is similar to the items already explained above in this manual. The last option to describe the imaginary creation is the database.
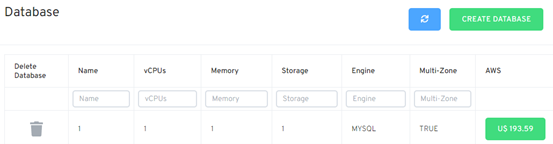
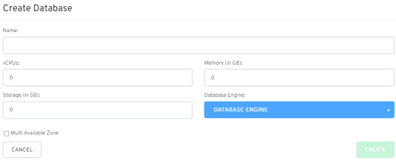
For the operation to be successful, it is necessary to fill in Name, vCPUs, memory in GB, Storage in GB, engine that are used and, if it should be multizone, or not.
After the creation is received a table with the data that were created and the existing market prices.
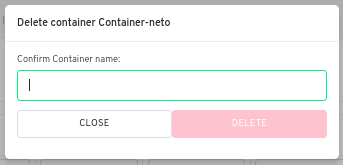
In case the user considers necessary to delete the Imaginary Cloud, after the creation of all these items, there is the option to delete any of them at any given moment, in case of deleting the items inside the container, click on the trash symbol to the left of the table. To erase the container, click on it and fill a modal with the name of the item you want to delete.
Container Hint
The last uSavings menu functionality is the Container Hint, it presents the resources that apparently are not being used or are not generating supposedly unnecessary costs.
The functionality is available for the accounts connected and integrated with the uCloud Platform.
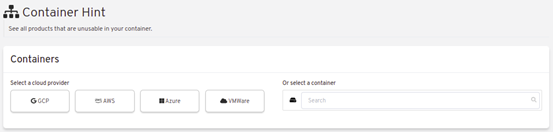
When connecting the public cloud account on the uCloud Platform, the picture above is listed. In this selection image by type of cloud or container, the types of clouds providers can be selected:
(i) GCP;
(II) AWS;
(III) AZURE;
(IV) VMware or select a container.
The user must select one of the four clouds that they want to search to find out which resources are apparently not used or generate supposedly unnecessary costs.
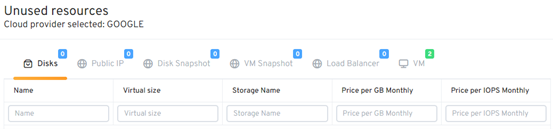
After selecting the desired cloud, the screen presents a list that allows searching in the following resources:
Disks - List of disks created and are not associated with any virtual machine;
Public IP - List of public IPs that were requested at some point that generate costs and are not associated with any virtual machine;
Disk Snapshot - List of all the snapshots disks created, does not distinguish which of them should or should not be deleted;
VM Snapshot - List of all the virtual machines snapshots created, it does not distinguish which of them should or should not be deleted;
Load Balancer - List of all the Load Balancer created, but it does not distinguish which of them should or should not be deleted;.
Virtual Machine - List of all the virtual machines created.
That way the user can do the research and find out which resources are not used or generate unnecessary costs to the organization.
uCloud
The last functionality menu presents the possibility of going to the uCloud platform, just by clicking on this menu the uSavings application directs the user to the uCloud platform.
Conclusion
Thus, this document concludes the general description of the procedures required for use. Reading this user manual allows the user of the application to use its functionalities properly.
Ustore Team
uSavings User’s Manual - 2nd Edition v.7 - 05/20/2022 - Reviewed 11/22/2022.